Pay Attention: Inflation Headline Is Misleading, Home Depot Earnings Show Consumer Weakness
Author: The Arora Report | August 13, 2024 11:09am
To gain an edge, this is what you need to know today.
Misleading Headline
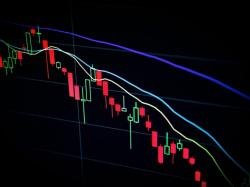
Please click here for an enlarged chart of Home Depot Inc (NYSE:HD).
Note the following:
This article is about the big picture, not an individual stock. The chart of HD stock is being used to illustrate the point.
Home Depot is an important stock because it is the largest home improvement retailer and its earnings give a glimpse into consumer sentiment. HD is also a component of the Dow Jones Industrial Average (DJIA).
The chart shows that HD pulled back 20% from its high in March to its low in May.
The chart shows that the rally from the low has made a double top. A double top is a negative pattern.
The chart shows that the double top was made at a level significantly below the high. This is a negative.
The chart shows the price drop on earnings.
HD reported good earnings but the stock is falling on weaker comp sales outlook. The weaker comp sales outlook shows that the consumer is weakening. Here are the details:
HD sees FY24 comp sales down 3% – 4% vs. down 1% prior.
HD reports adjusted EPS of $4.67 vs. $4.49 consensus.
HD reports revenues of $43.18B vs. $43.06B consensus.
RSI on the chart shows that HD stock is now oversold.
On the surface, Producer Price Index (PPI) came weaker than expected. Here are the details:
Headline PPI came at 0.1% vs. 0.1% consensus.
Core PPI came at 0.0% vs. 0.2% consensus.
As of this writing, the stock market is running up focusing on PPI headline. However, in The Arora Report analysis, digging below the surface, the data is not as good as it seems. PPI ex-food, energy, and trade came at 0.3% vs. 0.2% consensus. This indicates the companies' profit margins are compressing and in actuality, inflation is higher than reflected in the headline.
In The Arora Report analysis, compression in margins has a negative read through for earnings. This data, along with several other pieces of data, is indicating that Wall Street's estimates for future earnings may be too high.
Prudent investors know that in the long run, earnings are the single best determinant of the stock market.
Consumer Price Index (CPI) will be released tomorrow at 8:30am ET. CPI is more important than PPI.
Magnificent Seven Money Flows
In the early trade, money flows are positive in Apple Inc (NASDAQ:AAPL), Amazon.com, Inc. (NASDAQ:AMZN), Alphabet Inc Class C (NASDAQ:GOOG), Meta Platforms Inc (NASDAQ:META), Microsoft Corp (NASDAQ:MSFT), NVIDIA Corp (NASDAQ:NVDA), and Tesla Inc (NASDAQ:TSLA).
In the early trade, money flows are mixed in SPDR S&P 500 ETF Trust (NYSE:SPY) and Invesco QQQ Trust Series 1 (NASDAQ:QQQ).
Momo Crowd And Smart Money In Stocks
Investors can gain an edge by knowing money flows in SPY and QQQ. Investors can get a bigger edge by knowing when smart money is buying stocks, gold, and oil. The most popular ETF for gold is SPDR Gold Trust (NYSE:GLD). The most popular ETF for silver is iShares Silver Trust (NYSE:SLV). The most popular ETF for oil is United States Oil ETF (ASCA:USO).
It is important for investors to look ahead and not in the rearview mirror.
Consider continuing to hold good, very long term, existing positions. Based on individual risk preference, consider a protection band consisting of cash or Treasury bills or short-term tactical trades as well as short to medium term hedges and short term hedges. This is a good way to protect yourself and participate in the upside at the same time.
You can determine your protection bands by adding cash to hedges. The high band of the protection is appropriate for those who are older or conservative. The low band of the protection is appropriate for those who are younger or aggressive. If you do not hedge, the total cash level should be more than stated above but significantly less than cash plus hedges.
A protection band of 0% would be very bullish and would indicate full investment with 0% in cash. A protection band of 100% would be very bearish and would indicate a need for aggressive protection with cash and hedges or aggressive short selling.
It is worth reminding that you cannot take advantage of new upcoming opportunities if you are not holding enough cash. When adjusting hedge levels, consider adjusting partial stop quantities for stock positions (non ETF); consider using wider stops on remaining quantities and also allowing more room for high beta stocks. High beta stocks are the ones that move more than the market.
Traditional 60/40 Portfolio
Probability based risk reward adjusted for inflation does not favor long duration strategic bond allocation at this time.
Those who want to stick to traditional 60% allocation to stocks and 40% to bonds may consider focusing on only high quality bonds and bonds of five year duration or less. Those willing to bring sophistication to their investing may consider using bond ETFs as tactical positions and not strategic positions at this time.
The Arora Report is known for its accurate calls. The Arora Report correctly called the big artificial intelligence rally before anyone else, the new bull market of 2023, the bear market of 2022, new stock market highs right after the virus low in 2020, the virus drop in 2020, the DJIA rally to 30,000 when it was trading at 16,000, the start of a mega bull market in 2009, and the financial crash of 2008. Please click here to sign up for a free forever Generate Wealth Newsletter.