Alibaba Vs. JD: Which Chinese E-Commerce Stock Is The Better Investment Ahead Of Earnings?
Author: Surbhi Jain | August 14, 2024 11:18am
As Alibaba Group Holding Ltd (NYSE:BABA) (NYSE:BABAF) and JD.com Inc (NASDAQ:JD) gear up to report earnings Thursday, investors are eyeing which stock offers the best opportunity. Here’s a head-to-head comparison to help determine which Chinese tech giant might be the better investment.
Alibaba's Bullish Surge Vs. JD's Slump
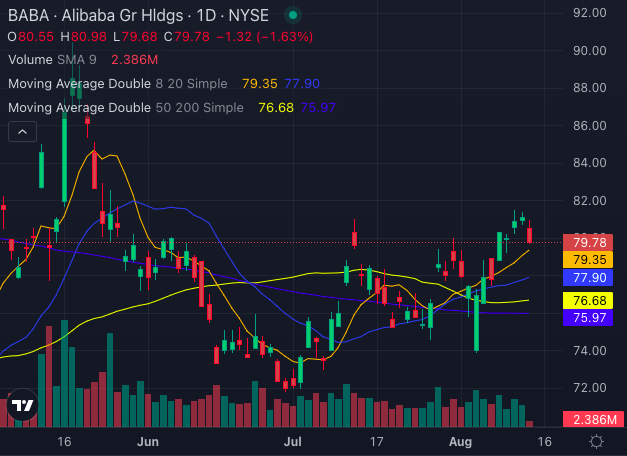
Alibaba stock has climbed approximately 8% year-to-date, despite a 13.6% drop over the past year. The company is expected to report first-quarter earnings with an EPS estimate of $2.11 and annual revenue of $941.2 billion.
Analysts are generally bullish on Alibaba stock, with a consensus rating of Buy and price target of $118.94. Recent ratings from BofA Securities, Jefferies and Loop Capital suggest an average price target of $112.33, indicating potential upside of nearly 39%.
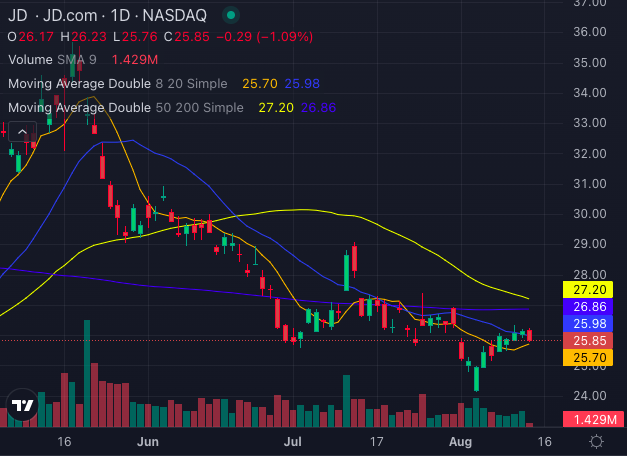
On the other hand, JD.com has faced a tougher year, with its stock down about 4% year-to-date and over 29% in the past year. The company is set to report second-quarter earnings with an EPS estimate of 83 cents and a quarterly revenue estimate of $40.8 billion.
JD stock’s consensus rating is also Buy, but its price target is considerably lower at $41.53. The recent average price target from Barclays, Loop Capital and Benchmark suggests a 60.55% upside.
Alibaba stock is trading above its five, 20 and 50-day exponential moving averages, signaling buying pressure. Its current price is above the eight, 20, 50 and 200-day simple moving averages, reinforcing a bulling signal.
Conversely, JD.com stock’s technical indicators paint a mixed picture. While the eight-day simple moving average suggests a bullish signal, the 20, 50 and 200-day simple moving averages point toward a bearish signal. This indicates potential caution despite some positive buying pressure.
Alibaba appears to be in a stronger technical position with higher potential upside based on recent analyst ratings and technical indicators.
JD.com, though offering a higher upside percentage, has faced a more challenging market and mixed technical signals.
Investors will need to weigh these factors carefully as both companies prepare to unveil their latest earnings results.