Cannabis Chart Of The Week: Which Leverage Metric Should Investors Keep A Close Eye On?
Author: Viridian Capital Advisors | August 19, 2024 12:44pm
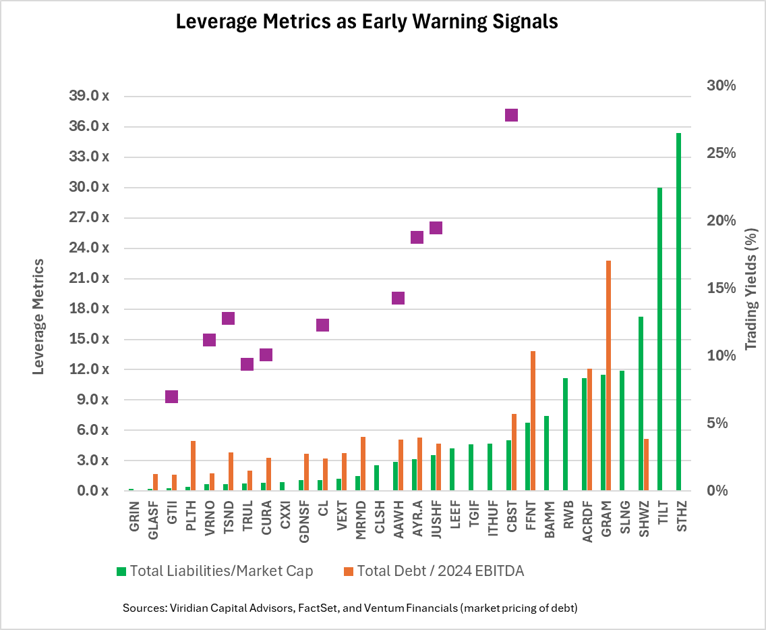
The cannabis credit markets have come back to life with several major refinancings, including Ascend (OTC:AAWH), TerrAscend (OTC:TSNDF), and Jushi (OTC:JUSHF). The market has become more sophisticated with a tremendous spread of yields required based on perceived credit quality, ranging from well under 10% for Green Thumb (OTC:GTBIF) to over 25% for Cannabist (OTC:CBSTF).
The graph shows two leverage metrics: Total Liabilities to Market Cap (green bar) and Total Debt/ 2024 EBITDA (orange bar). The purple squares show offered side trading yields for the debt of each company.
The graph clearly shows that trading yields are much better correlated with total liabilities to market cap than with Debt/ EBITDA, and the former is an excellent early warning sign of credit difficulties.
Viridian uses Total Liabilities to Market Cap as the most important of our four leverage ratios for several reasons:
The metric can be calculated for all public companies, not just the minority of them with sell-side analyst coverage.
The measure is responsive to all information driving equity prices on a daily basis, as opposed to Debt/ EBITDA, which generally changes only quarterly.
Total liabilities takes into account all balance sheet lease liabilities as well as all recognized tax liabilities.
The ratio figures prominently in the credit research literature, and a variant is included in several important bankruptcy prediction models, including Altman’s Z-score.
We view companies with total liabilities to market cap of less than 2x as having significant financial flexibility and strong asset value coverage of liabilities. Companies between 2x and 7x typically do not have high near-term default risk; however, they have lower financial flexibility to withstand an unexpected adverse event and may have significant refinancing risk at debt maturities.
Investors should monitor total liabilities to market cap as an early warning indicator. It is essential to watch the weekly change in the ratio for consistency in the direction and magnitude of movement. We have been noting, for example, a severe deterioration in the ratio for Schwazze over the last month.
We view 7x as a signal of serious risk of default or restructuring. Investors should devote analytical resources to evaluate investment positions in companies over 7x as these companies may have liquidity pressures that may trigger the need for highly dilutive “rescue financing.”
There is no substitute for a detailed, sophisticated, and regularly updated financial model to anticipate credit pressure points. However, monitoring a straightforward ratio on a consistent basis can provide investors with a valuable early warning sign.
The Viridian Capital Chart of the Week highlights key investment, valuation and M&A trends taken from the Viridian Cannabis Deal Tracker.
The Viridian Cannabis Deal Tracker provides the market intelligence that cannabis companies, investors, and acquirers utilize to make informed decisions regarding capital allocation and M&A strategy. The Deal Tracker is a proprietary information service that monitors capital raise and M&A activity in the legal cannabis, CBD, and psychedelics industries. Each week the Tracker aggregates and analyzes all closed deals and segments each according to key metrics:
-
Deals by Industry Sector (To track the flow of capital and M&A Deals by one of 12 Sectors - from Cultivation to Brands to Software)
-
Deal Structure (Equity/Debt for Capital Raises, Cash/Stock/Earnout for M&A) Status of the company announcing the transaction (Public vs. Private)
-
Principals to the Transaction (Issuer/Investor/Lender/Acquirer) Key deal terms (Pricing and Valuation)
-
Key Deal Terms (Deal Size, Valuation, Pricing, Warrants, Cost of Capital)
-
Deals by Location of Issuer/Buyer/Seller (To Track the Flow of Capital and M&A Deals by State and Country)
-
Credit Ratings (Leverage and Liquidity Ratios)
Since its inception in 2015, the Viridian Cannabis Deal Tracker has tracked and analyzed more than 2,500 capital raises and 1,000 M&A transactions totaling over $50 billion in aggregate value.
The preceding article is from one of our external contributors. It does not represent the opinion of Benzinga and has not been edited.
Posted In: AAWH CBSTF GTBIF JUSHF TSNDF