Stock Of The Day: Marathon Digital's Downtrend May Be Over As Bullish Reversal Pattern Forms
Author: Mark Putrino | August 20, 2024 02:11pm
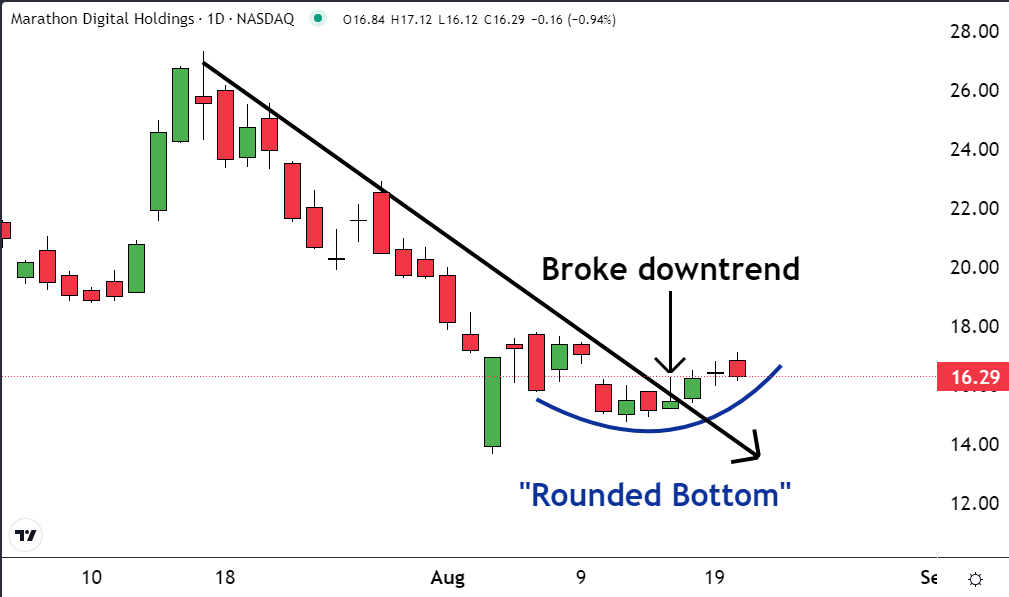
The downtrend that started a month ago in Marathon Digital Holdings, Inc. (NASDAQ:MARA) may have ended. It has broken the downtrend line. It has also formed a potential ‘Rounded Bottom' on the chart.
Both of these dynamics may have bullish implications. This is why we have identified MARA as our stock of the day.
As you can see on the chart, over the past few days, shares of MARA “broke” or crossed the downtrend line.
If a stock is moving lower, the first thing that must happen before it moves higher is for it to stop going down. If it trades sideways or is unchanged for a few days, the price action will make it cross the downtrend line on the chart.
This should be viewed as a signal that a new uptrend may be about to form. At the very least, it shows that for the time being the stock has stopped falling.
Reversal patterns graphically illustrate the price dynamics that occur when market leadership shifts between bulls and bears.
Sometimes this shift can occur in just one day. In the morning, it may seem like the current trend will persist, but by the close, the stock reverses direction and even surpasses the opening price. This creates a “bullish engulfing” pattern on the chart.
Sometimes the change can take place over a few volatile sessions. This might appear on a chart as a V-top or an inverted V-bottom.
But sometimes the change of the leadership is slow and it takes many trading sessions to complete. This type of price action tends to show up as a ‘rounded' top or bottom.
As you can see on the chart, it looks like shares of MARA may have formed a rounded bottom. The bulls have slowly and steadily taken control away from the bears.
This combination of breaking a downtrend line and forming a “rounded bottom” reversal pattern suggests there’s a good chance a new uptrend may be forming.