Baidu's Search For Stability: Can Q2 Earnings Counter Bearish Signals?
Author: Surbhi Jain | August 21, 2024 01:44pm
Baidu Inc (NASDAQ:BIDU) will be reporting its second-quarter earnings on Thursday. Wall Street expects $2.76 in EPS and $4.4 billion in revenues as the company reports before market hours.
The stock is down about 28.5% over the past year, 22.6% YTD.
Let’s look at what the charts indicate for Baidu stock and how the stock currently maps against Wall Street estimates.
Bearish Momentum Driving Baidu Stock Ahead of Q2 Earnings
Baidu’s stock is currently navigating through a mixed technical landscape, with several indicators pointing towards potential bearish momentum.
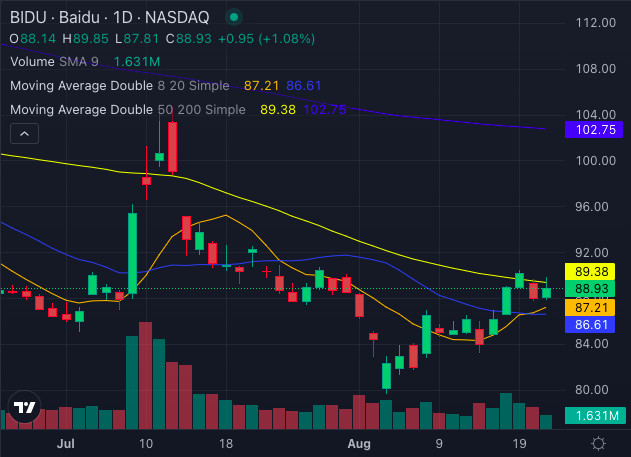
The stock is trading at $88.93, which positions it slightly above its eight-day and 20-day simple moving averages (SMAs) of $87.21 and $86.61, respectively. These levels typically signal a bullish trend, suggesting that Baidu may still have some short-term upward momentum.
However, the stock’s price is under its 50-day SMA of $89.38 and significantly below its 200-day SMA of $102.75, both of which are bearish signals. This divergence between short-term and long-term indicators reflects the underlying selling pressure that could drive further downside.
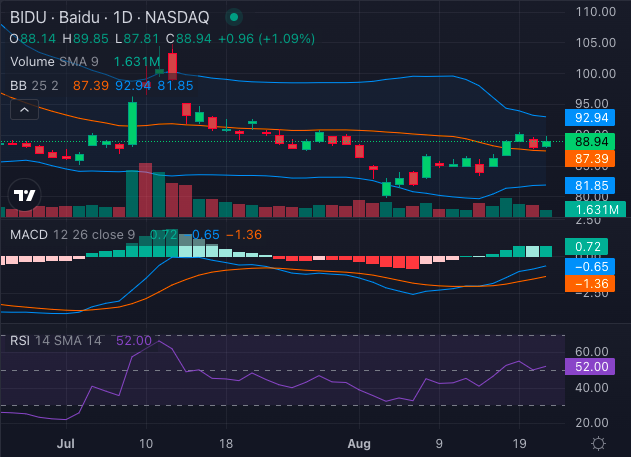
Moreover, Baidu’s Moving Average Convergence Divergence (MACD) indicator stands at a negative 0.65, reinforcing the bearish outlook by indicating that the stock’s momentum is currently in a downward phase.
The Relative Strength Index (RSI) is at 52 and treading upwards, suggesting the stock is heading towards being oversold, a condition that might typically signal a reversal. However, it’s not yet at a level that would decisively indicate a bullish turn.
Additionally, the Bollinger Bands suggest that Baidu’s price is trading beyond the lower bearish band, having recently inched up to the upper bullish band, seeking to find support.
Overall, while there are short-term bullish signals, the broader technical indicators lean towards a bearish outlook for Baidu in the near term.
Ratings & Consensus Estimates: The consensus analyst rating on Baidu stock stands at a Buy currently with a price target of $165.67. The latest analyst ratings from Bernstein, Benchmark and Barclays suggest an average price target of $130 for Baidu, implying a 45.19% upside.
BIDUPrice Action: Baidu stock was trading at $89.14 at the time of publication Wednesday.