This marks a dramatic leap from its year-low of $37.17, showcasing a stellar 34.97% year-to-date gain and a robust 36.77% increase over the past year. The past month alone has seen a notable 9.63% uptick.
Originally known as AuctionWeb, eBay began as a platform for auctioning antiques, second-hand items and collectibles. Over time, it has evolved into a major global marketplace for both new and used goods, offering both auction-style and fixed-priced listings.
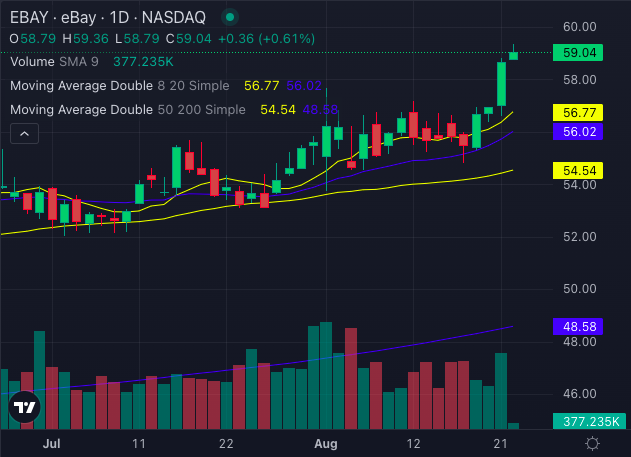
Bullish Signals Flashing On eBay Stock Chart
EBay's technical indicators are flashing green across the board.
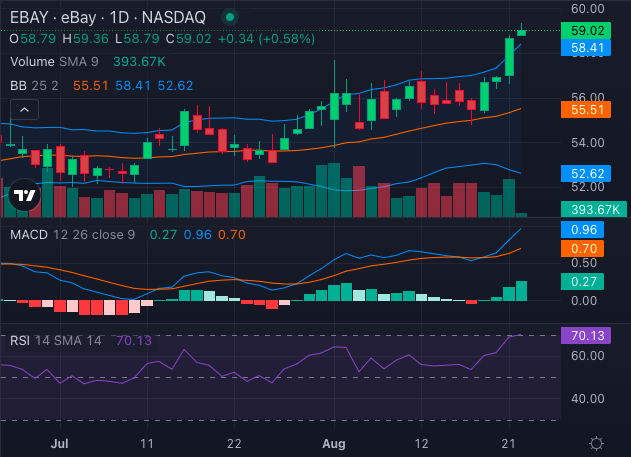
The Moving Average Convergence Divergence (MACD) at 0.96 adds to the bullish narrative, signaling continued upward momentum.
Meanwhile, the Bollinger Bands (25) have the with a range of $52.62 to $58.41, have eBay stock trading within the upper bullish band, supporting the stock's bullish stance.
Caution: Overheated Market?
While the bullish signs are compelling, eBay's Relative Strength Index (RSI) is at 70.13, lies in the overbought territory. This could mean the stock is ripe for a short-term correction or consolidation. This could also signal a potential pullback or consolidation in the near term.
EBay's impressive rise to new highs is backed by strong technical indicators, but with the RSI nearing overbought levels, caution is warranted.
Investors should keep an eye on these signals to navigate the current bullish landscape wisely.