Ford Stock Signals Trouble With Death Cross: A Bumpy Road Ahead?
Author: Surbhi Jain | August 23, 2024 11:01am
Ford Motor Co (NYSE:F) has hit a rough patch, making a Death Cross on the charts. The stock has been cruising downhill, falling 8.7% YTD and experiencing a sharp 19% dip over the past month.
This technical signal suggests a bearish turn, and here’s why investors should buckle up.
In a recent turn of events, Ford has hit the brakes on its ambitious EV plans. The company has scrapped its three-row electric SUV and delayed the electric F-150's debut to 2027.
While the E-Transit van continues to drive EV sales, the delay in new electric offerings raises concerns about Ford’s future in the electric vehicle race.
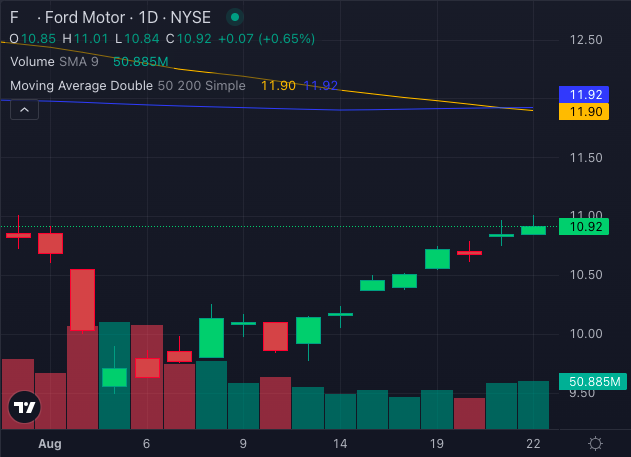
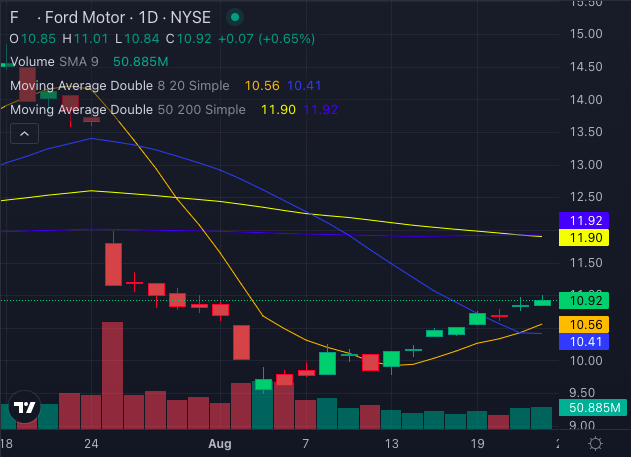
The Death Cross, where the 50-day SMA crosses below the 200-day SMA, spells trouble. Ford’s current stock price at $10.92 is trailing below its 50-day SMA of $11.90 and the 200-day SMA of $11.92, signaling potential further declines.
The eight-day SMA and 20-day SMA at $10.56 and $10.41 respectively, indicate a buying opportunity, but this is overshadowed by the overall downtrend.
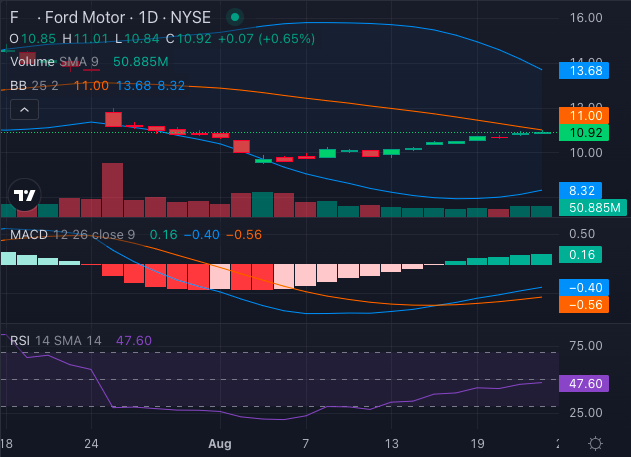
The Relative Strength Index (RSI) of 47.60 indicates a neutral condition, suggesting a lack of clear momentum rather than signaling an oversold or overbought market.
With Bollinger Bands showing a range of $8.32 – $13.68, the stock is trading in the lower band, suggesting a bearish signal.
Navigating Through Rough Terrain
Ford's stock is currently navigating through rough terrain with several technical indicators pointing towards a continued downtrend. While the E-Transit van is providing some positive momentum in the EV segment, the broader technical signals and recent setbacks suggest investors should approach Ford’s stock with caution.