Should Marathon Digital Investors Be Worried? Bitcoin Miner's Stock Heads Toward A Death Cross
Author: Surbhi Jain | August 26, 2024 09:34am
Marathon Digital Holdings Inc. (NASDAQ:MARA), a key player in the digital asset and cryptocurrency mining space, has been on a roller-coaster ride. While the stock is down 18.49% year-to-date, it has surged 75.99% over the past year, making it a favorite among investors looking for exposure to the blockchain ecosystem.
However, with the stock down 13.32% in the past month and moving averages hinting at a looming death cross, the question arises: should investors be concerned?
Death Cross Or Just A Bump In The Blockchain?
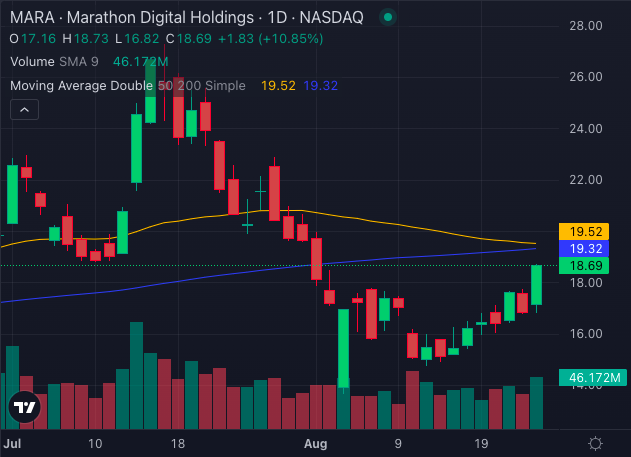
A death cross, a notorious technical pattern that occurs when a stock’s 50-day simple moving average (SMA) falls below its 200-day SMA, is often viewed as a bearish signal.
This pattern indicates a potential downtrend, raising red flags for Marathon Digital’s future price action.
As Marathon Digital stock’s moving averages inch closer to this ominous crossover, it's time to take a closer look at the technical indicators and what they spell for the stock.
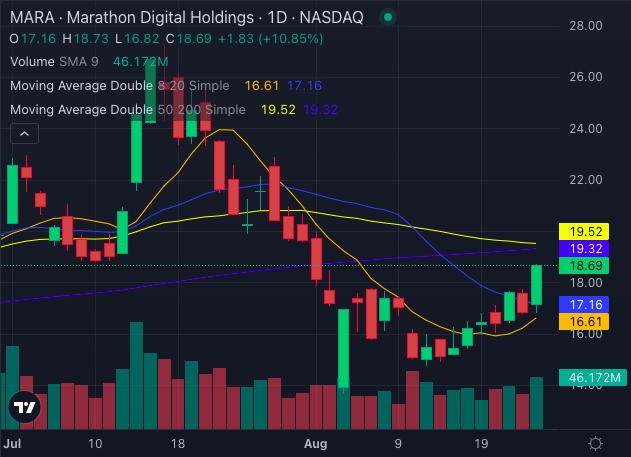
Currently, the stock is trading at $18.69 per share. That’s below its 50-day SMA at $19.52 and its 200-day SMA at $19.32. These figures suggest that the stock is in a potential downtrend, with both the 50-day and 200-day moving averages signaling a bearish trajectory.
Yet, it’s not all doom and gloom for Marathon Digital stock. Over the short term, indicators are bullish with the stock trading above the eight-day SMA at $16.61 and the 20-day SMA at $17.16.
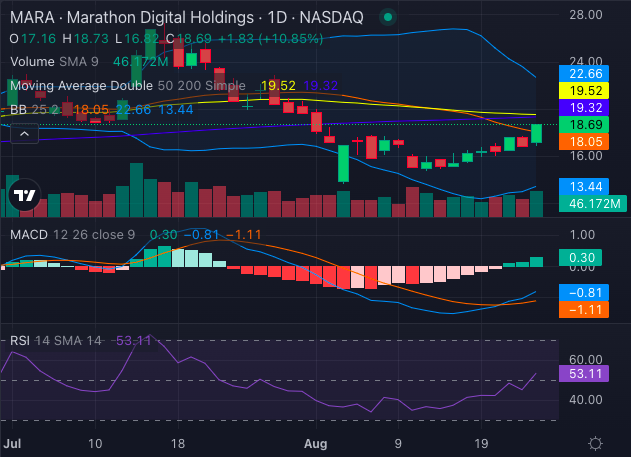
Additionally, the relative strength index (RSI) for MARA stands at 53.11, hovering near the neutral zone. While not in overbought territory, this reading suggests that there's still room for movement, but it doesn’t scream a buying opportunity just yet.
The Bollinger Bands, a volatility indicator, are currently set between $13.44 and $22.66, indicating the stock is within a range that could either break out or break down. With buying pressure seemingly stagnant, investors may want to keep an eye on these bands to see which direction Marathon Digital stock will head next.
So, should investors be wary?
The answer lies in the balance of bullish and bearish indicators. While the potential death cross looms, the mixed signals from other technical indicators suggest that MARA's fate is still up in the air. For now, cautious investors might consider watching from the sidelines until a clearer trend emerges.