Stock of the Day: Do Overbought Conditions Mean Builders FirstSource Is About To Reverse?
Author: Mark Putrino | August 26, 2024 12:40pm
Momentum refers to how far a stock's price has moved in a given time. For the most part, stocks stay within their average or typical range. If the price exceeds this range, the stock is considered to be overbought.
Three popular momentum indicators on the following chart show that shares of Builders FirstSource, Inc. (NYSE:BLDR) are overbought. This is why it's our Stock of the Day.
It's important to know when a stock is overbought. These stocks tend to reverse and move lower.
But traders need to exercise caution. There are dozens if not hundreds of tools that are used to measure momentum. These are called momentum indicators and are different ways of measuring the same thing.
Many successful traders use a limited number of these indicators. They get comfortable with just three or four and master them.
Many newer traders think more is better. They look at too many indicators and end up confused and overwhelmed with information.
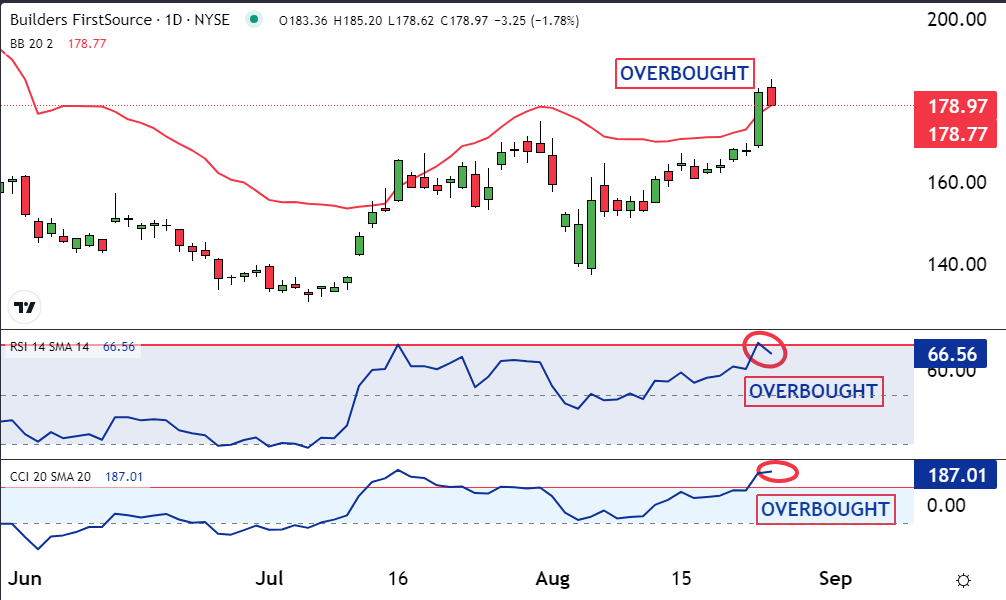
In the following chart, there are three indicators that all show Builders FirstSource to be overbought.
The red line on the price chart is a Bollinger Band. It is two standard deviations above the 20-day moving average. Statistics and probability theory suggest that 95% of all trading should be within two standard deviations of the mean.
If the price exceeds this threshold, like it has, the stock is considered overbought. This could draw sellers into the market.
On the bottom half of the chart, the indicator on the top is the Relative Strength Index (RSI). When the blue line exceeds the horizontal red line, it indicates overbought conditions. As you can see, that is the case now.
The bottom part of the lower half of the chart is the Commodity Channel Index (CCI). This is another simple yet effective indicator. It too indicates overbought conditions.
Many trading strategies and based on the concept of reversion to the mean. If a stock is overbought it will draw sellers into the market.
They will be expecting a reversal or move lower and selling could cause it to happen. This could be the case with shares ofBuilders FirstSource.