Delta Air Lines Stock Nears Death Cross: Time To Fasten Your Seat Belt?
Author: Surbhi Jain | August 26, 2024 03:53pm
Delta Air Lines Inc. (NYSE:DAL), a cornerstone of the American aviation industry and the oldest operating airline in the U.S., is heading into turbulent skies.
As the stock flirts with a Death Cross — a technical pattern where a short-term moving average crosses below a long-term moving average — investors are left wondering if it’s time to buckle up for a bumpy ride.
A Rough Patch For Delta
Recent events haven't been kind to Delta. The stock is up 1.29% year-to-date but has slid 3.40% over the past year, with a notable 7.16% drop in the last month.
Adding to the turbulence, Delta's COO, Michael Spanos is departing after just a year with the airline. His exit follows a major IT outage that grounded thousands of flights and cost the company a hefty $500 million — a loss that still lingers in the minds of investors.
The timing of Spanos's departure, coinciding with his appointment as CEO of Bloomin' Brands Inc (NASDAQ:BLMN), has raised eyebrows and added uncertainty to Delta's management landscape.
Delta Stock Chart Shows Technical Turbulence – Death Cross Looming
As Delta grapples with operational challenges, its stock’s technical indicators suggest more turbulence ahead. The approaching Death Cross typically signals bearish momentum, warning investors of potential downside.
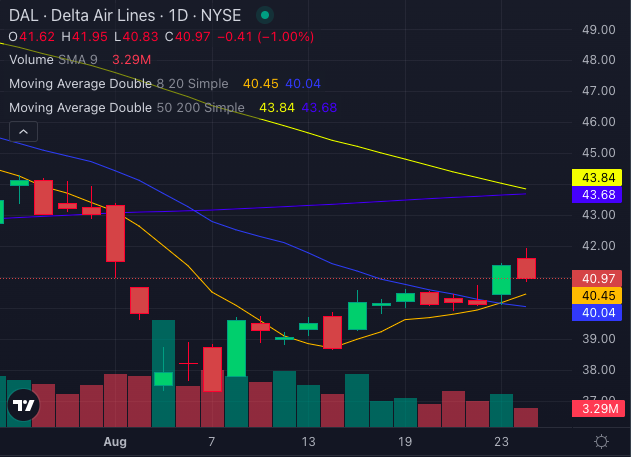
Delta's current share price sits at $40.97, just above the eight-day and 20-day simple moving averages (SMAs) of $40.45 and $40.04, respectively. These levels point to a bullish sentiment in the very short term.
However, the medium to long-term signals paint a different picture.
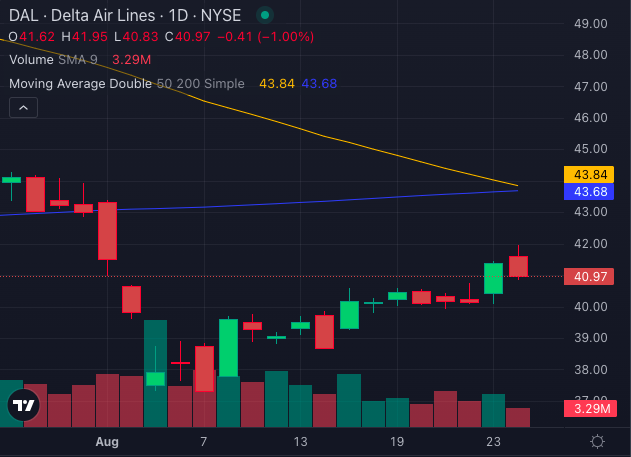
Delta's 50-day SMA stands at $43.84, well above the current share price, flashing a bearish signal. Similarly, the 200-day SMA at $43.68 reinforces the bearish outlook.
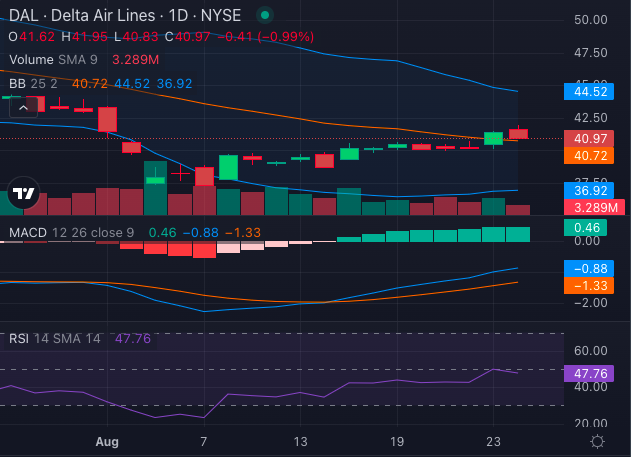
With the Moving Average Convergence Divergence (MACD) indicator at a negative 0.88 and the Relative Strength Index (RSI) at a neutral 47.76, the technicals suggest Delta is facing downward pressure, though currently it is neither overbought nor oversold.
Additionally, the Bollinger Bands (25) range from $36.92 to $44.52, indicating the stock is trading near its lower band — a bearish sign. The stock appears to be on the verge of entering the upper bullish band, but if other momentum and oscillator indicators do not support — it may be a tough hill to climb.
Delta Stock: Ready For A Takeoff — Or A Crash Landing?
While Delta's short-term technicals suggest a brief respite, the broader indicators are less encouraging.
Investors should keep a close eye on the impending Death Cross and be prepared for further volatility. For those with a stomach for turbulence, there may still be opportunities, but it could be a rough ride ahead.