Nvidia Stock Dips Despite Q2 Earnings Beat — Is The AI Rally Fading?
Author: Surbhi Jain | August 29, 2024 02:36pm
NVIDIA Corp (NASDAQ:NVDA) delivered another impressive performance with second-quarter earnings of 68 cents per share, beating expectations by 6.25%. Revenue came in at $30.04 billion, surpassing the $28.68 billion estimate by 4.73% and reflecting a jaw-dropping 122.40% increase from the same quarter last year.
Despite this earnings triumph, Nvidia’s stock slipped 3.6% in after-hours trading. On Thursday, it was down 5.66% at $118.50 at publication.
Let’s dig into the charts to assess what current trader sentiments have to say about the stock’s potential future trajectory.
Nvidia Stock Chart Giving Mixed Signals On Trend Analysis
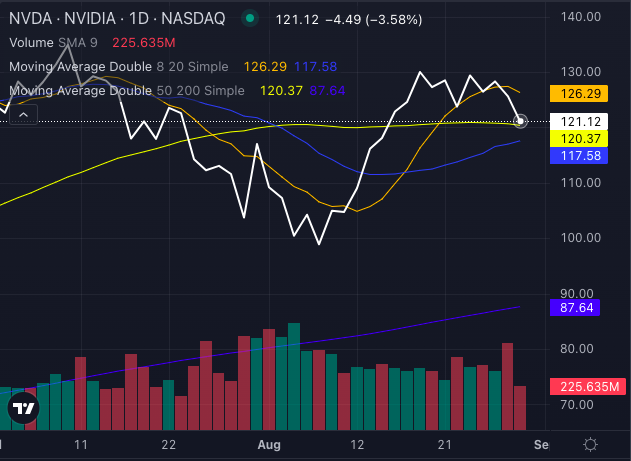
Short-Term vs. Long-Term: Nvidia's eight-day simple moving average (SMA) sits at $126.29, while the stock trades below it at $121.12, hinting at a bearish short-term outlook.
Conversely, the 20-day SMA at $117.58 and the 50-day SMA at $120.37 are both below the current price, signaling a bullish medium-term trend.
Long-Term Strength: The 200-day SMA is significantly lower at $87.64, reinforcing a bullish long-term perspective. Nvidia’s stock remains comfortably above this level, showcasing enduring strength.
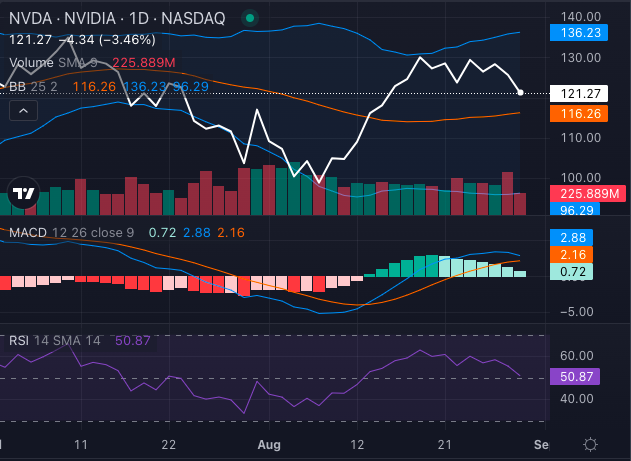
MACD: The Moving Average Convergence Divergence (MACD) at 2.28 supports a bullish stance, reflecting positive momentum. However, the signal line (orange line at $2.16) might just cross over the MACD line, as indicated by the chart. This would be considered a bearish signal, suggesting a reversal in the positive momentum.
RSI: The Relative Strength Index (RSI) is at 50.87, indicating the stock is neither overbought nor oversold currently. However, any rise in the MACD towards overbought levels beyond 70 could suggest caution.
Bollinger Bands: With the current price near the upper Bollinger Band of $136.23, the signal is bullish, though it also suggests a potential for a short-term pullback.
Nvidia Stock Verdict: Bullish But Watchful
Nvidia's technical indicators provide a predominantly bullish outlook, although the stock's short-term performance and approaching bearish MACD cross suggest a cautious approach might be wise.
The company's strong earnings performance contrasts with the recent dip, offering a mixed but hopeful technical picture.