This technical pattern occurs when a stock’s short-term moving average crosses above its long-term moving average, indicating a potential shift from a bearish to a bullish trend.
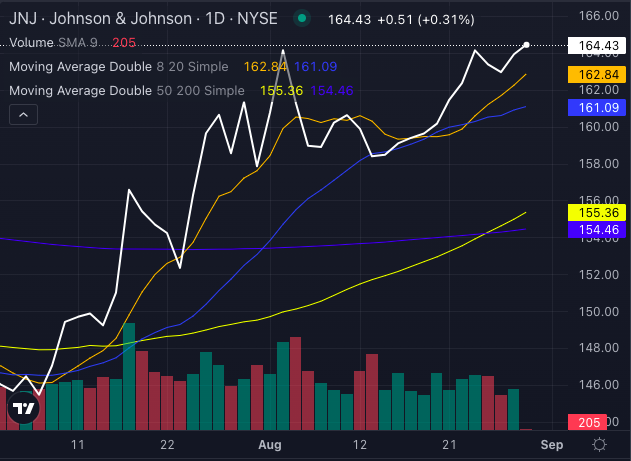
For Johnson & Johnson, the stock’s 50-day simple moving average (SMA) of $155.36 has crossed above the 200-day SMA of $154.46, signaling strong upward momentum.
Golden Cross: What It Means For Johnson & Johnson Investors
A Golden Cross is considered a bullish indicator, suggesting that Johnson & Johnson stock could be entering a period of sustained upward momentum.
The stock currently trades at $164.43, comfortably above its eight-day SMA of $162.84, 20-day SMA of $161.09 and 50-day SMA of $155.36. These signals collectively point towards strong buying pressure and a bullish trend.
Short-Term Strength: Moving Averages Confirm the Trend
8-Day SMA: With Johnson & Johnson stock trading at $164.43 against the eight-day SMA of $162.84, the short-term outlook remains bullish.
20-Day SMA: The 20-day SMA stands at $161.09, also below the current price, reinforcing the bullish sentiment.
50-Day SMA: Johnson & Johnson stock’s 50-day SMA of $155.36 further supports the bullish narrative, as the stock remains well above this level.
200-Day SMA: The long-term trend remains bullish as the current price far exceeds the 200-day SMA of $154.46.
Johnson & Johnson’s recent submission of a Biologics License Application (BLA) to the FDA for nipocalimab, aimed at treating generalized myasthenia gravis (gMG), adds a strong fundamental tailwind to the stock.
The company's ongoing efforts to expand its oncology pipeline, combined with strategic acquisitions like V-Wave Ltd., are set to bolster its growth prospects.
Bullish Signals For Johnson & Johnson
With the Golden Cross in play and a series of fundamental catalysts on the horizon, Johnson & Johnson’s stock appears poised for continued strength.
The bullish technical indicators and the company’s strategic initiatives position Johnson & Johnson as a compelling opportunity for investors looking to capitalize on its upward momentum.