Stock Of The Day: Berkshire Hathaway Trades Above Usual Range — Time To Sell The Warren Buffett Stock?
Author: Mark Putrino | September 03, 2024 11:53am
Most of the time, a stock stays within what would be its usual or typical trading range. Some stocks have wide ranges and some have narrow ones. It all depends on how volatile the shares are.
Berkshire Hathaway Inc. (NYSE:BRK) is trading above its usual range. This is why our team of technical analysts and trading experts have made it our ‘Stock of the Day'.
If a stock trades outside of its normal range, it could offer trading opportunities. Many traders will be expecting a reversal back into the range. This may be about to occur with the Warren Buffett-led firm.
If a stock is trading below its normal range, traders say it is ‘oversold'. This could bring buyers into the market. They will be anticipating a move higher back into the range. Their buying could drive the price up. It could be a self-fulfilling prophecy.
If the shares are trading above their usual range, traders say the stock is ‘overbought'. These conditions could draw sellers into the market. And their selling could push the shares lower.
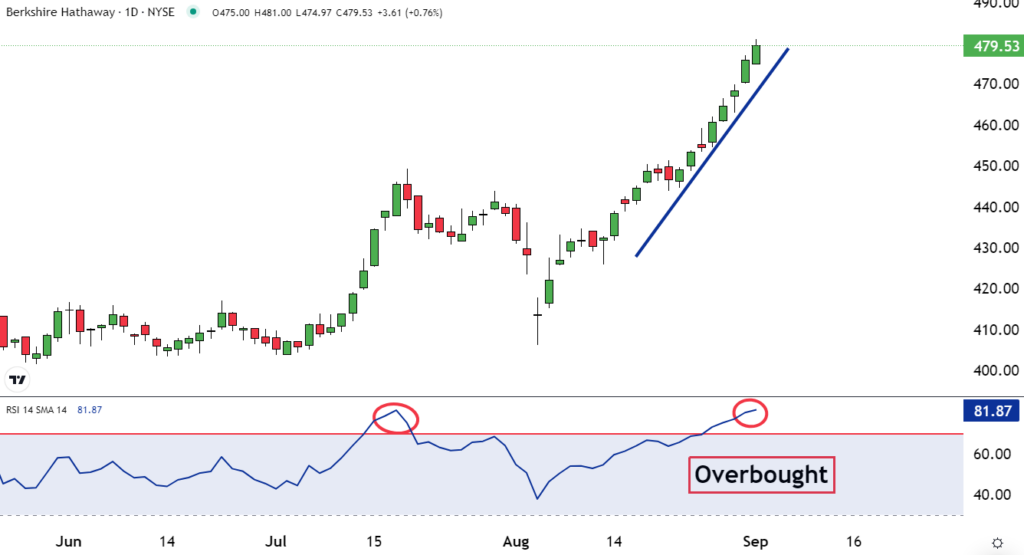
The bottom part of the chart is the Relative Strength Index (RSI). It is a way to measure momentum.
If the blue line is above the horizontal red line, it indicates overbought conditions. As you can see, this is the case now with shares of Berkshire.
The last time the shares were as overbought as they are now was in the middle of July. At the time, they were trading around the $445 level. This preceded a large move lower.
By early August BRK.B was trading close to $400.
There is no guarantee that the stock acts the way it did then. But successful traders try to stack the odds in their favor. They don't guess. They let the market tell them what to do.
And when a stock is overbought, the market is saying there's a good chance it heads lower.
Reversion to the mean is a common characteristic in trading algorithms and strategies. Shares of Berkshire may be about to show why.