Treasury Yields Plunge, TLT ETF Tops $100, VIX Spikes As 50-Basis-Point Rate Cut Odds Soar In Response To Jobs Data
Author: Piero Cingari | September 06, 2024 11:52am
The U.S. Treasury market rallied sharply on Friday after August labor data showed weaker-than-expected job growth, bolstering bets on Federal Reserve interest rate cuts.
The U.S. economy added 142,000 nonfarm payrolls last month, an increase from 89,000 in July but missing the expected increase to 160,000. The unemployment rate ticked down by 0.1% to 4.3% as expected, while wages displayed higher-than-forecasted growth.
Market-implied odds of a 50-basis-point rate cut in September surged to 61% as of 11:05 a.m. in New York, overtaking the 39% probability of a 25-basis-point cut, according to the CME Group‘s FedWatch data.
September Rate-Cut Probabilities After August Jobs Data
September Rate Cut
Now*
1 day ago (Sept. 5, 2024)
1 Week ago (Aug. 30, 2024)
50 basis points (0.5%)
61%
40%
30%
25 basis points (0.25%)
39%
60%
70%
* Data as of Sept. 6, 2024 11:05 a.m. ET, CME FedWatch
Traders poured into bonds amid growing expectations of declining interest rates, driving yields sharply lower across the Treasury curve.
The policy-sensitive two-year yield dropped over 10 basis points, reaching 3.59% at 11:15 a.m. in New York, its lowest level since March 2023.
The 10-year Treasury yield fell 6 basis points to 3.67%, marking its lowest point since June 2023.
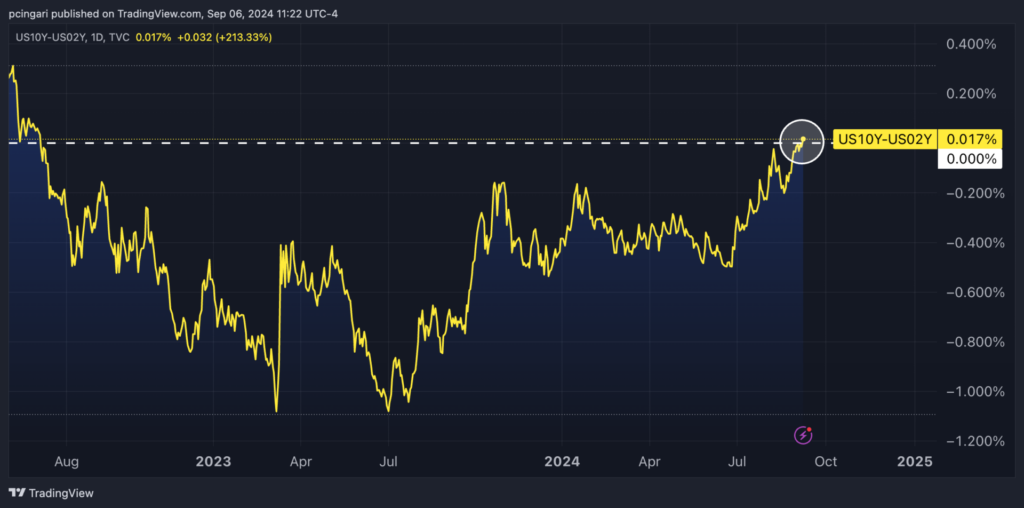
This movement has led to a positive slope in the Treasury yield curve from the 10-year onward, effectively ending the more than two-year period of yield curve inversion.
Chart: US Yield Curve Normalizes, Ending 2-Year Inversion
Market Reactions
Rate-cut expectations and falling Treasury yields triggered sharp moves across asset classes, with bonds rallying, the dollar weakening against the yen and equity markets sliding.
“No sooner than the payroll print hit, the algorithms marched into high gear, pushing Treasury yields lower as the disappointing headline number, coupled with a series of downward revisions, suggested a more dire economic backdrop perhaps requiring a heavier dose of Fed medicine on Sept. 18,” said Quincy Krosby, chief global strategist for LPL Financial.
Markets are wrestling with whether the August payroll data signals a labor market returning to pre-COVID norms or an economy losing critical momentum, Krosby said.
Treasury-related ETFs surged, with the iShares 20+ Year Treasury Bond ETF (NASDAQ:TLT) rising 1.1% to $100.65, on pace for its highest close since late July 2023.
The Japanese yen strengthened as well, with the Invesco CurrencyShares Japanese Yen Trust (NYSE:FXY) gaining over 1%, poised to close at its highest level since early January 2024.
Volatility spiked, as the CBOE Volatility Index (VIX) jumped 14% to 23.
Wall Street flipped to the red, with the SPDR S&P 500 ETF Trust (NYSE:SPY) dropping 1.5% on Friday, extending its weekly decline to 3.9%, on track for the worst weekly performance since March 2023.
Tech stocks were hit hardest, with the Invesco QQQ Trust (NASDAQ:QQQ) down 2.4%, pushing its weekly loss past 5%.
Nvidia Corp. (NASDAQ:NVDA) tumbled 4%, extending its weekly loss to 14%, its worst performance in two years.