Stock Of The Day: Amazon Delivers A Trading Lesson On Reversal Patterns
Author: Mark Putrino | September 09, 2024 02:28pm
If understood and applied correctly, technical analysis should be a study of market psychology and supply and demand. These are the dynamics that make stocks move.
The chart of Amazon.com, Inc. (NASDAQ:AMZN) illustrates some important technical analysis lessons. That's why it is our Stock of the Day.
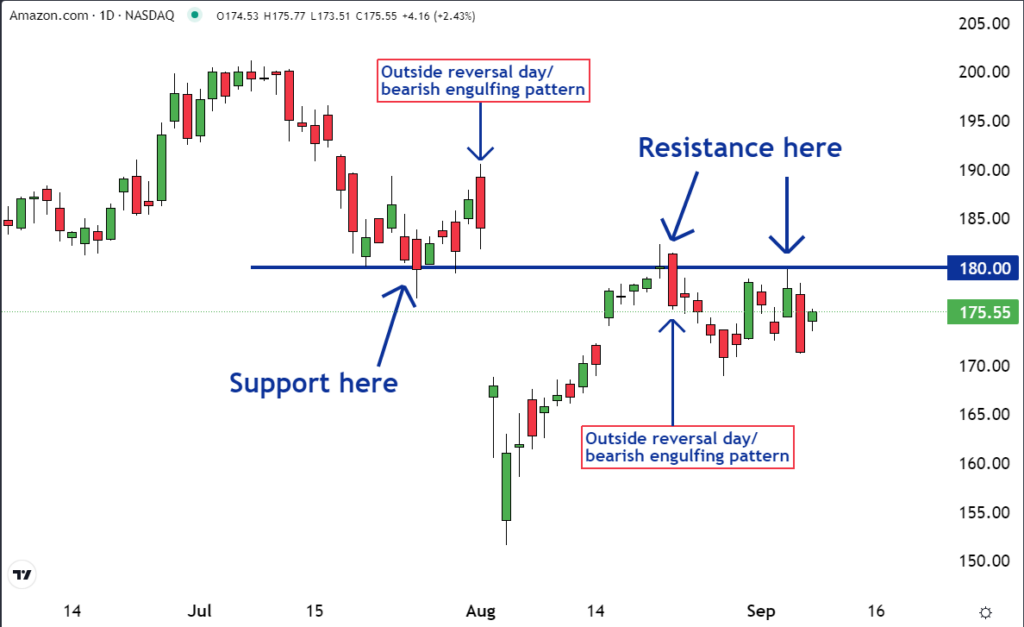
As you can see on the chart, the $180 level was support for Amazon in July. Now the level has converted into resistance.
Support turning into resistance is a common occurrence in the financial markets. It's because of regretful buyers.
Some of the people who bought Amazon while it was at support regretted doing so when the stock dropped just after. Some of these remorseful buyers decided to get out of their positions. But they don't want to lose money.
As a result, when the stock rallied and got back to their buy price, they sell. If there are enough remorseful buyers placing sell orders at the level that had been support, it can convert the level into resistance. This is what happened with Amazon.
The chart also gives a lesson on reversal patterns.
Reversal patterns can appear on charts when the leadership of the market is changing from bears to bulls or bulls to bears. Sometimes the change takes place over an extended time-period. But sometimes the change can take place in one day.
On the chart are two one-day reversal patterns. In Japanese candlesticks terminology, they are called ‘bearish engulfing patterns.' In Western terminology, they are referred to as ‘outside reversal days.'
The key to understanding patterns is to understand the trading dynamics they illustrate.
In the morning of the days that the patterns formed it looked like the recent uptrend would continue. The opening price was higher than the previous day's close.
But by the end of the day, the sellers overpowered the buyers. They pushed the price much lower. The stock ended up closing at a lower price than the previous day’s open. The trading on the day the pattern formed ‘engulfed' the prior day’s action.
New traders tend to get caught up with whether something is or isn't a specific pattern. But the names of the patterns are not important. What is, is to understand the trading action that caused the pattern to form.
Veteran traders don't care about the names. They care about the dynamics the patterns illustrate. This is why they profit.