Stock Of The Day: Two Indicators Suggest Proctor And Gamble May Have Reversed
Author: Mark Putrino | September 11, 2024 01:07pm
Trading models typically contain a set of parameters or conditions that must be met to give trade signals. Some human traders may only use one or two in their models while some quantitative ones may use hundreds.
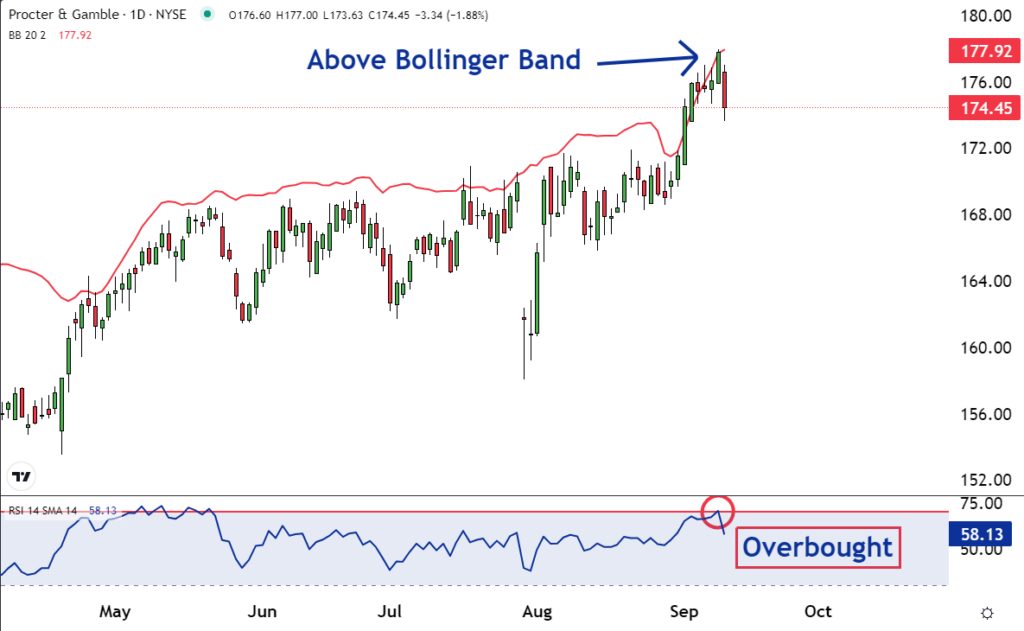
On the Procter & Gamble Co (NYSE:PG) chart, two possible parameters can be used as part of a model: the Bollinger Bands and the RSI Indicator. This makes it our “Stock of the Day.”
The red line on the price chart is a Bollinger Band. It is two standard deviations above the 20-day moving average.
This is important. Standard deviations are a statistical concept and many trading algorithms and strategies are based on statistics and probability theory. And they suggest that 95% of all trading should be within two standard deviations of the mean.
If a stock exceeds this threshold to the upside like Proctor and Gamble, it is considered overbought. This will draw sellers into the market because they expect a reversion to the mean or a move lower.
Their selling could push the stock lower. It could be a self-fulfilling prophecy.
The bottom half of the chart is the Relative Strength Index (RSI). This is another tool that traders use to determine if a stock is overbought. If the blue line exceeds the horizontal red line, it indicates overbought conditions. This could also draw sellers into the market.
A possible trading signal to sell could be when the Bollinger Bands and the RSI simultaneously show a stock to be overbought.
As you can see on the chart, in late April the stock’s price exceeded the upper Bollinger Band. However, the RSI did not indicate overbought conditions. This means there would have been no sell signal.
Earlier this month the price exceeded the upper Bollinger Band but RSI did not move above the horizontal line. This means there was no reversal or sell signal.
On Sept.10, both indicators showed the stock to be overbought at the same time. And as you can see, it looks like a reversal has begun and a move lower could follow.
Using two parameters to trigger sell signals can be a profitable way to trade. The chart of Proctor and Gamble is an illustration of this.