Stock Of The Day: Is Meta On The Brink Of A Major Breakout?
Author: Mark Putrino | September 18, 2024 11:49am
EssilorLuxottica announced on Tuesday that is has extended its partnership with Meta Platforms, Inc. (NASDAQ:META), through a new long-term deal to develop multi-generational smart eyewear. While financial terms remain undisclosed, the collaboration has already produced two generations of Ray-Ban smart glasses since 2019.
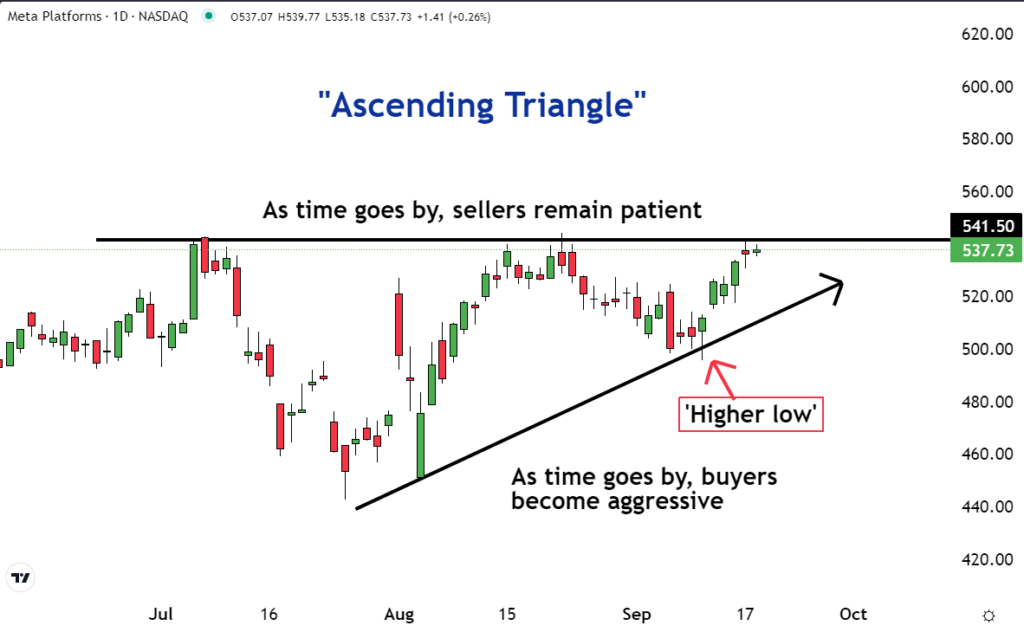
Meanwhile, on the technical front, an ascending triangle pattern has formed on Meta’s chart. This pattern can have bullish implications, and it may mean that the stock is about to break out and move higher. This is why our team of trading experts has made it our “Stock of the Day.”
As you can see on the chart, since July, there has been resistance around the $541.50 level. Every time the stock rallied and reached this price, it reversed.
The important dynamic is that the traders and investors who caused the resistance to form with their sell orders have remained patient. They have been willing to stay at their prices and let the buyers come to them.
But over the same time, the buyers have become more aggressive, and have been willing to pay higher prices.
On the chart, there is a ‘higher low'. The low formed in September did so at a higher price than the one formed in early August.
This is why the support line on the bottom part of the pattern is ascending or slanted higher.
The ascending triangle pattern is a graphical illustration of patient or complacent sellers and aggressive buyers. These dynamics can set the stage for a move higher.
Resistance is a large group of traders and investors who are looking to sell at, or close to, the same price. In this case, it's around $541.50.
If the resistance breaks it could mean that a new uptrend is about to form. If the stock trades above the resistance, it is an indication that the people who created the resistance with their sell orders have left the market.
They have finished or canceled their orders. With this large amount of supply off the market, buyers will have no choice but to continue to pay higher prices if they wish to acquire shares.
The ascending triangle pattern on the chart of META means there is a good chance the resistance breaks and the stock rallies.