Earnings Preview: Anywhere Real Estate
Author: Benzinga Insights | April 28, 2025 02:02pm
Anywhere Real Estate (NYSE:HOUS) is set to give its latest quarterly earnings report on Tuesday, 2025-04-29. Here's what investors need to know before the announcement.
Analysts estimate that Anywhere Real Estate will report an earnings per share (EPS) of $-0.58.
Anticipation surrounds Anywhere Real Estate's announcement, with investors hoping to hear about both surpassing estimates and receiving positive guidance for the next quarter.
New investors should understand that while earnings performance is important, market reactions are often driven by guidance.
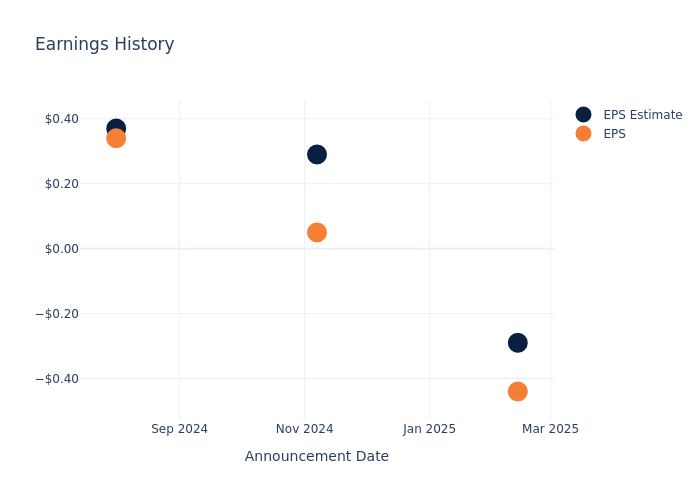
Earnings Track Record
During the last quarter, the company reported an EPS missed by $0.15, leading to a 6.03% increase in the share price on the subsequent day.
Here's a look at Anywhere Real Estate's past performance and the resulting price change:
| Quarter |
Q4 2024 |
Q3 2024 |
Q2 2024 |
Q1 2024 |
| EPS Estimate |
-0.29 |
0.29 |
0.37 |
-0.67 |
| EPS Actual |
-0.44 |
0.05 |
0.34 |
-0.79 |
| Price Change % |
6.0% |
2.0% |
1.0% |
3.0% |
Anywhere Real Estate Share Price Analysis
Shares of Anywhere Real Estate were trading at $3.18 as of April 25. Over the last 52-week period, shares are down 38.37%. Given that these returns are generally negative, long-term shareholders are likely bearish going into this earnings release.
Analyst Observations about Anywhere Real Estate
For investors, staying informed about market sentiments and expectations in the industry is paramount. This analysis provides an exploration of the latest insights on Anywhere Real Estate.
The consensus rating for Anywhere Real Estate is Neutral, derived from 1 analyst ratings. An average one-year price target of $4.5 implies a potential 41.51% upside.
Analyzing Analyst Ratings Among Peers
In this comparison, we explore the analyst ratings and average 1-year price targets of RE/MAX Holdings and Opendoor Technologies, three prominent industry players, offering insights into their relative performance expectations and market positioning.
- Analysts currently favor an Neutral trajectory for RE/MAX Holdings, with an average 1-year price target of $9.0, suggesting a potential 183.02% upside.
- Analysts currently favor an Neutral trajectory for Opendoor Technologies, with an average 1-year price target of $1.38, suggesting a potential 56.6% downside.
Summary of Peers Analysis
The peer analysis summary presents essential metrics for RE/MAX Holdings and Opendoor Technologies, unveiling their respective standings within the industry and providing valuable insights into their market positions and comparative performance.
| Company |
Consensus |
Revenue Growth |
Gross Profit |
Return on Equity |
| Anywhere Real Estate |
Neutral |
8.96% |
$476M |
-4.01% |
| RE/MAX Holdings |
Neutral |
-5.40% |
$53.81M |
1.36% |
| Opendoor Technologies |
Neutral |
24.60% |
$85M |
-14.93% |
Key Takeaway:
Anywhere Real Estate is positioned in the middle among its peers for revenue growth. It ranks at the bottom for gross profit and return on equity.
Get to Know Anywhere Real Estate Better
Anywhere Real Estate Inc operates in residential real estate, focusing on brokerage, relocation, title, settlement businesses, and mortgage and title insurance ventures. It supports approximately 1 million home sale sides annually. Brands include Better Homes and Gardens, CENTURY 21, Coldwell Banker, Corcoran, ERA, and Sotheby's International Realty. Revenue comes mainly from existing home transactions. Operations are segmented into Anywhere Brands (franchises), Anywhere Advisors (owned brokerage), and Anywhere Integrated Services (title and settlement).
Anywhere Real Estate's Economic Impact: An Analysis
Market Capitalization: Indicating a reduced size compared to industry averages, the company's market capitalization poses unique challenges.
Revenue Growth: Anywhere Real Estate displayed positive results in 3 months. As of 31 December, 2024, the company achieved a solid revenue growth rate of approximately 8.96%. This indicates a notable increase in the company's top-line earnings. When compared to others in the Real Estate sector, the company faces challenges, achieving a growth rate lower than the average among peers.
Net Margin: Anywhere Real Estate's net margin falls below industry averages, indicating challenges in achieving strong profitability. With a net margin of -4.7%, the company may face hurdles in effective cost management.
Return on Equity (ROE): The company's ROE is a standout performer, exceeding industry averages. With an impressive ROE of -4.01%, the company showcases effective utilization of equity capital.
Return on Assets (ROA): The company's ROA is a standout performer, exceeding industry averages. With an impressive ROA of -1.12%, the company showcases effective utilization of assets.
Debt Management: Anywhere Real Estate's debt-to-equity ratio is notably higher than the industry average. With a ratio of 1.95, the company relies more heavily on borrowed funds, indicating a higher level of financial risk.
To track all earnings releases for Anywhere Real Estate visit their earnings calendar on our site.
This article was generated by Benzinga's automated content engine and reviewed by an editor.
Posted In: HOUS


