Preview: Star Bulk Carriers's Earnings
Author: Benzinga Insights | May 13, 2025 10:02am
Star Bulk Carriers (NASDAQ:SBLK) is gearing up to announce its quarterly earnings on Wednesday, 2025-05-14. Here's a quick overview of what investors should know before the release.
Analysts are estimating that Star Bulk Carriers will report an earnings per share (EPS) of $-0.29.
The announcement from Star Bulk Carriers is eagerly anticipated, with investors seeking news of surpassing estimates and favorable guidance for the next quarter.
It's worth noting for new investors that guidance can be a key determinant of stock price movements.
Performance in Previous Earnings
In the previous earnings release, the company missed EPS by $0.07, leading to a 8.72% drop in the share price the following trading session.
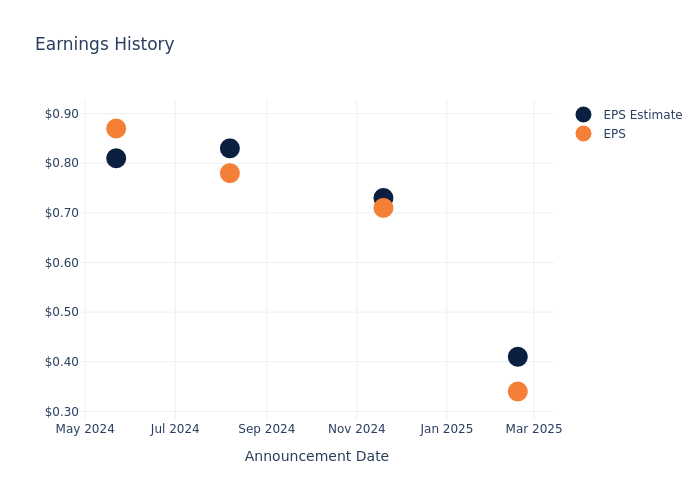
Here's a look at Star Bulk Carriers's past performance and the resulting price change:
| Quarter |
Q4 2024 |
Q3 2024 |
Q2 2024 |
Q1 2024 |
| EPS Estimate |
0.41 |
0.73 |
0.83 |
0.81 |
| EPS Actual |
0.34 |
0.71 |
0.78 |
0.87 |
| Price Change % |
-9.0% |
-5.0% |
-0.0% |
2.0% |
Performance of Star Bulk Carriers Shares
Shares of Star Bulk Carriers were trading at $16.2 as of May 12. Over the last 52-week period, shares are down 36.35%. Given that these returns are generally negative, long-term shareholders are likely bearish going into this earnings release.
Insights Shared by Analysts on Star Bulk Carriers
For investors, staying informed about market sentiments and expectations in the industry is paramount. This analysis provides an exploration of the latest insights on Star Bulk Carriers.
Star Bulk Carriers has received a total of 1 ratings from analysts, with the consensus rating as Buy. With an average one-year price target of $21.0, the consensus suggests a potential 29.63% upside.
Comparing Ratings with Peers
The below comparison of the analyst ratings and average 1-year price targets of ZIM Integrated Shipping, Golden Ocean Group and Global Ship Lease, three prominent players in the industry, gives insights for their relative performance expectations and market positioning.
- Analysts currently favor an Underperform trajectory for ZIM Integrated Shipping, with an average 1-year price target of $13.63, suggesting a potential 15.86% downside.
- Analysts currently favor an Neutral trajectory for Golden Ocean Group, with an average 1-year price target of $9.0, suggesting a potential 44.44% downside.
- Analysts currently favor an Buy trajectory for Global Ship Lease, with an average 1-year price target of $29.0, suggesting a potential 79.01% upside.
Insights: Peer Analysis
Within the peer analysis summary, vital metrics for ZIM Integrated Shipping, Golden Ocean Group and Global Ship Lease are presented, shedding light on their respective standings within the industry and offering valuable insights into their market positions and comparative performance.
| Company |
Consensus |
Revenue Growth |
Gross Profit |
Return on Equity |
| Star Bulk Carriers |
Buy |
17.25% |
$74.11M |
1.70% |
| ZIM Integrated Shipping |
Underperform |
79.84% |
$731M |
14.10% |
| Golden Ocean Group |
Neutral |
-17.01% |
$39.56M |
2.04% |
| Global Ship Lease |
Buy |
2.28% |
$99.10M |
6.33% |
Key Takeaway:
Star Bulk Carriers ranks at the top for Gross Profit and Return on Equity among its peers. It is in the middle for Revenue Growth.
Unveiling the Story Behind Star Bulk Carriers
Star Bulk Carriers Corp provides seaborne transportation solutions in the dry bulk sector. The company owns and operates dry bulk carrier vessels, which are used to transport bulk, such as iron ore, coal, grains, bauxite, fertilizers, and steel products. It owns a fleet of vessels that consists of Newcastlemax, Capesize, Post Panamax, Kamsarmax, Panamax, Ultramax, and Supramax. It generates revenues through the voyages it carries out.
Unraveling the Financial Story of Star Bulk Carriers
Market Capitalization: Positioned above industry average, the company's market capitalization underscores its superiority in size, indicative of a strong market presence.
Positive Revenue Trend: Examining Star Bulk Carriers's financials over 3 months reveals a positive narrative. The company achieved a noteworthy revenue growth rate of 17.25% as of 31 December, 2024, showcasing a substantial increase in top-line earnings. As compared to its peers, the company achieved a growth rate higher than the average among peers in Industrials sector.
Net Margin: Star Bulk Carriers's net margin is below industry averages, indicating potential challenges in maintaining strong profitability. With a net margin of 13.74%, the company may face hurdles in effective cost management.
Return on Equity (ROE): Star Bulk Carriers's ROE lags behind industry averages, suggesting challenges in maximizing returns on equity capital. With an ROE of 1.7%, the company may face hurdles in achieving optimal financial performance.
Return on Assets (ROA): Star Bulk Carriers's ROA is below industry standards, pointing towards difficulties in efficiently utilizing assets. With an ROA of 1.03%, the company may encounter challenges in delivering satisfactory returns from its assets.
Debt Management: With a below-average debt-to-equity ratio of 0.59, Star Bulk Carriers adopts a prudent financial strategy, indicating a balanced approach to debt management.
To track all earnings releases for Star Bulk Carriers visit their earnings calendar on our site.
This article was generated by Benzinga's automated content engine and reviewed by an editor.
Posted In: SBLK


