A Glimpse Into The Expert Outlook On Hudson Pacific Properties Through 10 Analysts
Author: Benzinga Insights | May 23, 2025 10:00am
In the latest quarter, 10 analysts provided ratings for Hudson Pacific Properties (NYSE:HPP), showcasing a mix of bullish and bearish perspectives.
The table below summarizes their recent ratings, showcasing the evolving sentiments within the past 30 days and comparing them to the preceding months.
|
Bullish |
Somewhat Bullish |
Indifferent |
Somewhat Bearish |
Bearish |
| Total Ratings |
0 |
3 |
6 |
1 |
0 |
| Last 30D |
0 |
0 |
1 |
0 |
0 |
| 1M Ago |
0 |
1 |
0 |
0 |
0 |
| 2M Ago |
0 |
1 |
2 |
0 |
0 |
| 3M Ago |
0 |
1 |
3 |
1 |
0 |
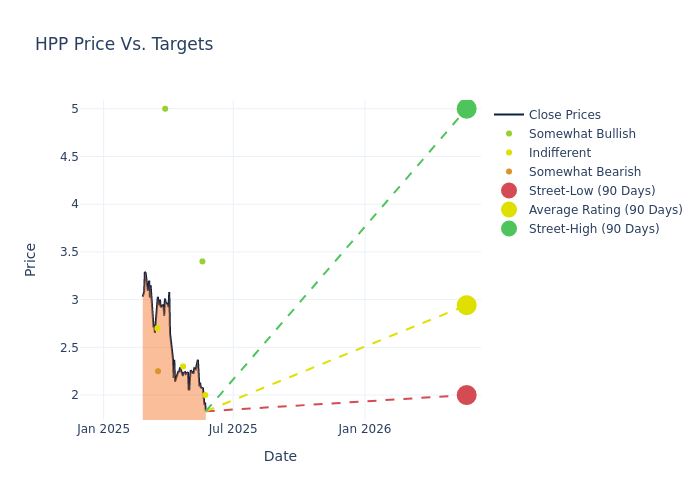
The 12-month price targets assessed by analysts reveal further insights, featuring an average target of $3.1, a high estimate of $5.00, and a low estimate of $2.00. A 11.93% drop is evident in the current average compared to the previous average price target of $3.52.
Exploring Analyst Ratings: An In-Depth Overview
The analysis of recent analyst actions sheds light on the perception of Hudson Pacific Properties by financial experts. The following summary presents key analysts, their recent evaluations, and adjustments to ratings and price targets.
| Analyst |
Analyst Firm |
Action Taken |
Rating |
Current Price Target |
Prior Price Target |
| Alexander Goldfarb |
Piper Sandler |
Lowers |
Neutral |
$2.00 |
$2.50 |
| Blaine Heck |
Wells Fargo |
Lowers |
Overweight |
$3.40 |
$4.00 |
| Caitlin Burrows |
Goldman Sachs |
Lowers |
Neutral |
$2.30 |
$3.40 |
| Alexander Goldfarb |
Piper Sandler |
Lowers |
Neutral |
$2.50 |
$3.50 |
| John Kim |
BMO Capital |
Raises |
Outperform |
$5.00 |
$4.00 |
| Ronald Kamdem |
Morgan Stanley |
Lowers |
Underweight |
$2.25 |
$2.40 |
| Peter Abramowitz |
Jefferies |
Announces |
Hold |
$2.70 |
- |
| Blaine Heck |
Wells Fargo |
Announces |
Overweight |
$4.00 |
- |
| Caitlin Burrows |
Goldman Sachs |
Lowers |
Neutral |
$3.40 |
$3.90 |
| Alexander Goldfarb |
Piper Sandler |
Lowers |
Neutral |
$3.50 |
$4.50 |
Key Insights:
- Action Taken: Responding to changing market dynamics and company performance, analysts update their recommendations. Whether they 'Maintain', 'Raise', or 'Lower' their stance, it signifies their response to recent developments related to Hudson Pacific Properties. This offers insight into analysts' perspectives on the current state of the company.
- Rating: Unveiling insights, analysts deliver qualitative insights into stock performance, from 'Outperform' to 'Underperform'. These ratings convey expectations for the relative performance of Hudson Pacific Properties compared to the broader market.
- Price Targets: Analysts set price targets as an estimate of a stock's future value. Comparing the current and prior price targets provides insight into how analysts' expectations have changed over time. This information can be valuable for investors seeking to understand consensus views on the stock's potential future performance.
Assessing these analyst evaluations alongside crucial financial indicators can provide a comprehensive overview of Hudson Pacific Properties's market position. Stay informed and make well-judged decisions with the assistance of our Ratings Table.
Stay up to date on Hudson Pacific Properties analyst ratings.
If you are interested in following small-cap stock news and performance you can start by tracking it here.
About Hudson Pacific Properties
Hudson Pacific Properties Inc is a real estate investment trust that acquires, operates, and owns office buildings and media and entertainment properties, such as sound stages, on America's West Coast. The company focuses on developed, urban markets in Northern California, Southern California, and the Pacific Northwest. In terms of total square footage, the vast majority of Hudson Pacific's real estate portfolio is composed of office properties located in the Greater Seattle, San Francisco, and Los Angeles areas. The company operates in two reportable segments; office properties & related operations; and studio properties & related operations. The majority of revenue is derived from the office properties & related operations segment.
Financial Insights: Hudson Pacific Properties
Market Capitalization Analysis: Below industry benchmarks, the company's market capitalization reflects a smaller scale relative to peers. This could be attributed to factors such as growth expectations or operational capacity.
Revenue Challenges: Hudson Pacific Properties's revenue growth over 3M faced difficulties. As of 31 March, 2025, the company experienced a decline of approximately -7.27%. This indicates a decrease in top-line earnings. In comparison to its industry peers, the company trails behind with a growth rate lower than the average among peers in the Real Estate sector.
Net Margin: Hudson Pacific Properties's net margin is below industry averages, indicating potential challenges in maintaining strong profitability. With a net margin of -37.64%, the company may face hurdles in effective cost management.
Return on Equity (ROE): The company's ROE is below industry benchmarks, signaling potential difficulties in efficiently using equity capital. With an ROE of -3.12%, the company may need to address challenges in generating satisfactory returns for shareholders.
Return on Assets (ROA): Hudson Pacific Properties's ROA falls below industry averages, indicating challenges in efficiently utilizing assets. With an ROA of -0.93%, the company may face hurdles in generating optimal returns from its assets.
Debt Management: Hudson Pacific Properties's debt-to-equity ratio stands notably higher than the industry average, reaching 1.96. This indicates a heavier reliance on borrowed funds, raising concerns about financial leverage.
The Core of Analyst Ratings: What Every Investor Should Know
Benzinga tracks 150 analyst firms and reports on their stock expectations. Analysts typically arrive at their conclusions by predicting how much money a company will make in the future, usually the upcoming five years, and how risky or predictable that company's revenue streams are.
Analysts attend company conference calls and meetings, research company financial statements, and communicate with insiders to publish their ratings on stocks. Analysts typically rate each stock once per quarter or whenever the company has a major update.
Some analysts also offer predictions for helpful metrics such as earnings, revenue, and growth estimates to provide further guidance as to what to do with certain tickers. It is important to keep in mind that while stock and sector analysts are specialists, they are also human and can only forecast their beliefs to traders.
Breaking: Wall Street's Next Big Mover
Benzinga's #1 analyst just identified a stock poised for explosive growth. This under-the-radar company could surge 200%+ as major market shifts unfold. Click here for urgent details.
This article was generated by Benzinga's automated content engine and reviewed by an editor.
Posted In: HPP