Earnings Preview For ANI Pharmaceuticals
Author: Benzinga Insights | August 07, 2025 10:04am
ANI Pharmaceuticals (NASDAQ:ANIP) is preparing to release its quarterly earnings on Friday, 2025-08-08. Here's a brief overview of what investors should keep in mind before the announcement.
Analysts expect ANI Pharmaceuticals to report an earnings per share (EPS) of $1.26.
The market awaits ANI Pharmaceuticals's announcement, with hopes high for news of surpassing estimates and providing upbeat guidance for the next quarter.
It's important for new investors to understand that guidance can be a significant driver of stock prices.
Past Earnings Performance
During the last quarter, the company reported an EPS beat by $1.76, leading to a 0.0% drop in the share price on the subsequent day.
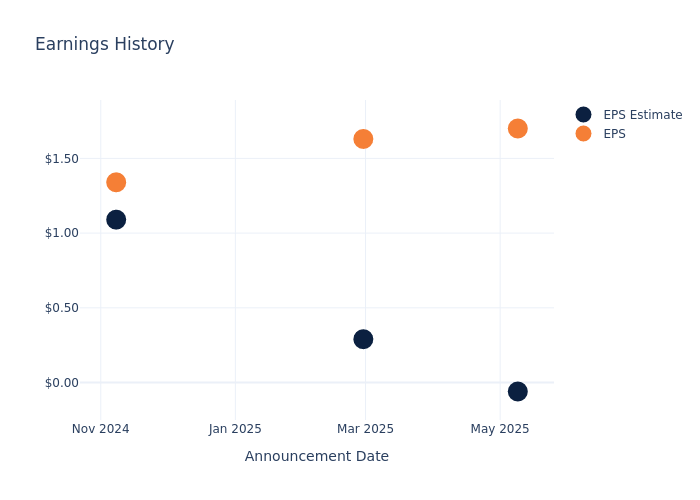
Here's a look at ANI Pharmaceuticals's past performance and the resulting price change:
| Quarter |
Q1 2025 |
Q4 2024 |
Q3 2024 |
Q2 2024 |
| EPS Estimate |
-0.06 |
0.29 |
1.09 |
0.94 |
| EPS Actual |
1.70 |
1.63 |
1.34 |
1.02 |
| Price Change % |
-7.000000000000001% |
13.0% |
5.0% |
-10.0% |
Tracking ANI Pharmaceuticals's Stock Performance
Shares of ANI Pharmaceuticals were trading at $69.09 as of August 06. Over the last 52-week period, shares are up 20.57%. Given that these returns are generally positive, long-term shareholders should be satisfied going into this earnings release.
Analyst Observations about ANI Pharmaceuticals
For investors, grasping market sentiments and expectations in the industry is vital. This analysis explores the latest insights regarding ANI Pharmaceuticals.
A total of 2 analyst ratings have been received for ANI Pharmaceuticals, with the consensus rating being Buy. The average one-year price target stands at $85.0, suggesting a potential 23.03% upside.
Comparing Ratings with Peers
In this analysis, we delve into the analyst ratings and average 1-year price targets of Liquidia, Tarsus Pharmaceuticals and Harrow, three key industry players, offering insights into their relative performance expectations and market positioning.
- Analysts currently favor an Buy trajectory for Liquidia, with an average 1-year price target of $26.75, suggesting a potential 61.28% downside.
- Analysts currently favor an Buy trajectory for Tarsus Pharmaceuticals, with an average 1-year price target of $72.0, suggesting a potential 4.21% upside.
- Analysts currently favor an Buy trajectory for Harrow, with an average 1-year price target of $68.0, suggesting a potential 1.58% downside.
Key Findings: Peer Analysis Summary
Within the peer analysis summary, vital metrics for Liquidia, Tarsus Pharmaceuticals and Harrow are presented, shedding light on their respective standings within the industry and offering valuable insights into their market positions and comparative performance.
| Company |
Consensus |
Revenue Growth |
Gross Profit |
Return on Equity |
| ANI Pharmaceuticals |
Buy |
43.43% |
$124.08M |
3.72% |
| Liquidia |
Buy |
4.98% |
$1.60M |
-60.43% |
| Tarsus Pharmaceuticals |
Buy |
183.68% |
$73.12M |
-8.86% |
| Harrow |
Buy |
38.29% |
$32.31M |
-28.20% |
Key Takeaway:
ANI Pharmaceuticals ranks at the top for Revenue Growth and Gross Profit among its peers. However, it ranks at the bottom for Return on Equity. Overall, ANI Pharmaceuticals is positioned favorably compared to its peers in terms of financial performance metrics.
Unveiling the Story Behind ANI Pharmaceuticals
ANI Pharmaceuticals Inc develops, manufactures, and markets generic prescription pharmaceuticals. It manufactures liquid, powder, and oral solid-dose products. Its areas of product development include narcotics, oncolytics, hormones and steroids, and complex formulations involving extended-release and combination products. Some of its generic products include Erythromycin ethyl succinate, Esterified Estrogen with Methyltestosterone (EEMT), Etodolac Fenofibrate, Fluvoxamine, Hydrocortisone Enema and Vancomycin. The company operates in two segments which include Rare Diseases and Brands, Generics, and Others. Its geographical segments are the United States and Canada, of which the majority of its revenue comes from the United States.
Understanding the Numbers: ANI Pharmaceuticals's Finances
Market Capitalization Analysis: Falling below industry benchmarks, the company's market capitalization reflects a reduced size compared to peers. This positioning may be influenced by factors such as growth expectations or operational capacity.
Revenue Growth: ANI Pharmaceuticals's remarkable performance in 3 months is evident. As of 31 March, 2025, the company achieved an impressive revenue growth rate of 43.43%. This signifies a substantial increase in the company's top-line earnings. As compared to competitors, the company surpassed expectations with a growth rate higher than the average among peers in the Health Care sector.
Net Margin: The company's net margin is a standout performer, exceeding industry averages. With an impressive net margin of 7.75%, the company showcases strong profitability and effective cost control.
Return on Equity (ROE): ANI Pharmaceuticals's financial strength is reflected in its exceptional ROE, which exceeds industry averages. With a remarkable ROE of 3.72%, the company showcases efficient use of equity capital and strong financial health.
Return on Assets (ROA): ANI Pharmaceuticals's financial strength is reflected in its exceptional ROA, which exceeds industry averages. With a remarkable ROA of 1.19%, the company showcases efficient use of assets and strong financial health.
Debt Management: The company faces challenges in debt management with a debt-to-equity ratio higher than the industry average. With a ratio of 1.49, caution is advised due to increased financial risk.
To track all earnings releases for ANI Pharmaceuticals visit their earnings calendar on our site.
This article was generated by Benzinga's automated content engine and reviewed by an editor.
Posted In: ANIP


