Exploring ChargePoint Hldgs's Earnings Expectations
Author: Benzinga Insights | September 02, 2025 10:01am
ChargePoint Hldgs (NYSE:CHPT) is gearing up to announce its quarterly earnings on Wednesday, 2025-09-03. Here's a quick overview of what investors should know before the release.
Analysts are estimating that ChargePoint Hldgs will report an earnings per share (EPS) of $-1.51.
Investors in ChargePoint Hldgs are eagerly awaiting the company's announcement, hoping for news of surpassing estimates and positive guidance for the next quarter.
It's worth noting for new investors that stock prices can be heavily influenced by future projections rather than just past performance.
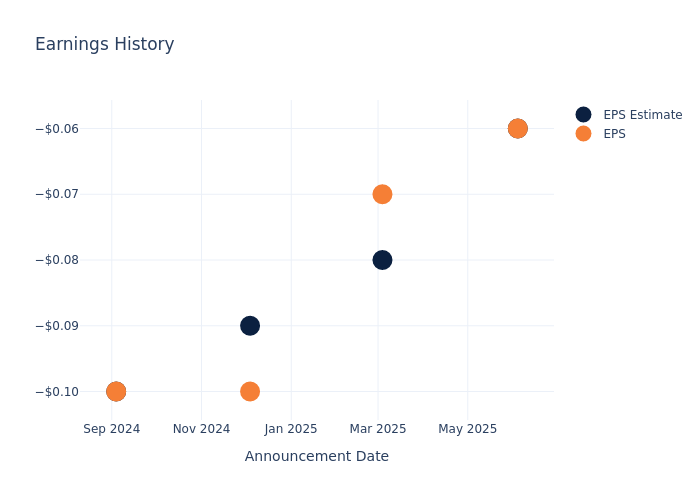
Earnings Track Record
Last quarter the company missed EPS by $0.00, which was followed by a 22.49% drop in the share price the next day.
Here's a look at ChargePoint Hldgs's past performance and the resulting price change:
| Quarter |
Q1 2026 |
Q4 2025 |
Q3 2025 |
Q2 2025 |
| EPS Estimate |
-0.06 |
-0.08 |
-0.09 |
-0.1 |
| EPS Actual |
-0.06 |
-0.07 |
-0.10 |
-0.1 |
| Price Change % |
-22.0% |
10.0% |
11.0% |
-18.0% |
Performance of ChargePoint Hldgs Shares
Shares of ChargePoint Hldgs were trading at $11.27 as of September 01. Over the last 52-week period, shares are down 68.05%. Given that these returns are generally negative, long-term shareholders are likely bearish going into this earnings release.
Analysts' Perspectives on ChargePoint Hldgs
For investors, grasping market sentiments and expectations in the industry is vital. This analysis explores the latest insights regarding ChargePoint Hldgs.
The consensus rating for ChargePoint Hldgs is Neutral, derived from 1 analyst ratings. An average one-year price target of $1.0 implies a potential 91.13% downside.
Comparing Ratings Among Industry Peers
The below comparison of the analyst ratings and average 1-year price targets of Blink Charging, FuelCell Energy and FTC Solar, three prominent players in the industry, gives insights for their relative performance expectations and market positioning.
- Analysts currently favor an Buy trajectory for Blink Charging, with an average 1-year price target of $3.0, suggesting a potential 73.38% downside.
- Analysts currently favor an Neutral trajectory for FuelCell Energy, with an average 1-year price target of $8.0, suggesting a potential 29.02% downside.
- Analysts currently favor an Neutral trajectory for FTC Solar, with an average 1-year price target of $5.5, suggesting a potential 51.2% downside.
Peer Analysis Summary
The peer analysis summary outlines pivotal metrics for Blink Charging, FuelCell Energy and FTC Solar, demonstrating their respective standings within the industry and offering valuable insights into their market positions and comparative performance.
| Company |
Consensus |
Revenue Growth |
Gross Profit |
Return on Equity |
| ChargePoint Hldgs |
Neutral |
-8.78% |
$27.99M |
-44.62% |
| Blink Charging |
Buy |
-13.78% |
$2.06M |
-36.87% |
| FuelCell Energy |
Neutral |
66.84% |
$-9.44M |
-6.24% |
| FTC Solar |
Neutral |
74.92% |
$-3.92M |
-125.60% |
Key Takeaway:
ChargePoint Hldgs ranks at the bottom for Revenue Growth and Gross Profit among its peers. It is also at the bottom for Return on Equity.
All You Need to Know About ChargePoint Hldgs
ChargePoint Holdings Inc designs, develops, and markets networked electric vehicle charging system infrastructure and cloud-based services that enable consumers to locate, reserve, and authenticate EV charging. The company's hardware product lineup includes solutions across home, commercial, and fast-charging applications. ChargePoint derives the majority of its revenue from the United States.
ChargePoint Hldgs: Financial Performance Dissected
Market Capitalization Analysis: Below industry benchmarks, the company's market capitalization reflects a smaller scale relative to peers. This could be attributed to factors such as growth expectations or operational capacity.
Revenue Growth: ChargePoint Hldgs's revenue growth over a period of 3 months has faced challenges. As of 30 April, 2025, the company experienced a revenue decline of approximately -8.78%. This indicates a decrease in the company's top-line earnings. As compared to its peers, the revenue growth lags behind its industry peers. The company achieved a growth rate lower than the average among peers in Industrials sector.
Net Margin: ChargePoint Hldgs's net margin is below industry averages, indicating potential challenges in maintaining strong profitability. With a net margin of -58.5%, the company may face hurdles in effective cost management.
Return on Equity (ROE): ChargePoint Hldgs's ROE is below industry averages, indicating potential challenges in efficiently utilizing equity capital. With an ROE of -44.62%, the company may face hurdles in achieving optimal financial returns.
Return on Assets (ROA): ChargePoint Hldgs's ROA lags behind industry averages, suggesting challenges in maximizing returns from its assets. With an ROA of -6.36%, the company may face hurdles in achieving optimal financial performance.
Debt Management: ChargePoint Hldgs's debt-to-equity ratio is notably higher than the industry average. With a ratio of 2.72, the company relies more heavily on borrowed funds, indicating a higher level of financial risk.
To track all earnings releases for ChargePoint Hldgs visit their earnings calendar on our site.
This article was generated by Benzinga's automated content engine and reviewed by an editor.
Posted In: CHPT


