Carlyle Group Stock: A Deep Dive Into Analyst Perspectives (9 Ratings)
Author: Benzinga Insights | September 10, 2025 04:03pm
9 analysts have expressed a variety of opinions on Carlyle Group (NASDAQ:CG) over the past quarter, offering a diverse set of opinions from bullish to bearish.
The following table encapsulates their recent ratings, offering a glimpse into the evolving sentiments over the past 30 days and comparing them to the preceding months.
|
Bullish |
Somewhat Bullish |
Indifferent |
Somewhat Bearish |
Bearish |
| Total Ratings |
1 |
5 |
3 |
0 |
0 |
| Last 30D |
0 |
0 |
0 |
0 |
0 |
| 1M Ago |
0 |
1 |
1 |
0 |
0 |
| 2M Ago |
0 |
3 |
0 |
0 |
0 |
| 3M Ago |
1 |
1 |
2 |
0 |
0 |
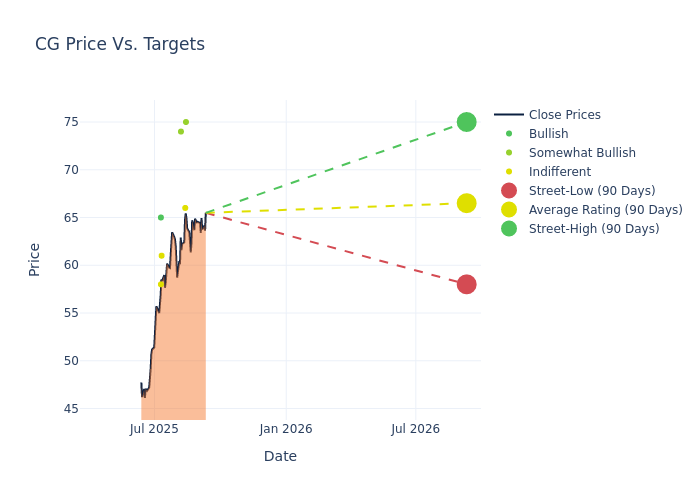
Analysts' evaluations of 12-month price targets offer additional insights, showcasing an average target of $66.56, with a high estimate of $75.00 and a low estimate of $58.00. Marking an increase of 20.06%, the current average surpasses the previous average price target of $55.44.
Analyzing Analyst Ratings: A Detailed Breakdown
The analysis of recent analyst actions sheds light on the perception of Carlyle Group by financial experts. The following summary presents key analysts, their recent evaluations, and adjustments to ratings and price targets.
| Analyst |
Analyst Firm |
Action Taken |
Rating |
Current Price Target |
Prior Price Target |
| Brian McKenna |
JMP Securities |
Raises |
Market Outperform |
$75.00 |
$70.00 |
| Gerald O'Hara |
Jefferies |
Raises |
Hold |
$66.00 |
$54.00 |
| Benjamin Budish |
Barclays |
Raises |
Overweight |
$74.00 |
$66.00 |
| Devin Ryan |
JMP Securities |
Raises |
Market Outperform |
$70.00 |
$58.00 |
| Benjamin Budish |
Barclays |
Raises |
Overweight |
$66.00 |
$64.00 |
| Michael Brown |
Wells Fargo |
Raises |
Equal-Weight |
$61.00 |
$49.00 |
| Benjamin Budish |
Barclays |
Raises |
Overweight |
$64.00 |
$49.00 |
| Glenn Schorr |
Evercore ISI Group |
Raises |
In-Line |
$58.00 |
$45.00 |
| Christopher Allen |
Citigroup |
Raises |
Buy |
$65.00 |
$44.00 |
Key Insights:
- Action Taken: Analysts frequently update their recommendations based on evolving market conditions and company performance. Whether they 'Maintain', 'Raise' or 'Lower' their stance, it reflects their reaction to recent developments related to Carlyle Group. This information provides a snapshot of how analysts perceive the current state of the company.
- Rating: Providing a comprehensive analysis, analysts offer qualitative assessments, ranging from 'Outperform' to 'Underperform'. These ratings reflect expectations for the relative performance of Carlyle Group compared to the broader market.
- Price Targets: Analysts explore the dynamics of price targets, providing estimates for the future value of Carlyle Group's stock. This examination reveals shifts in analysts' expectations over time.
Understanding these analyst evaluations alongside key financial indicators can offer valuable insights into Carlyle Group's market standing. Stay informed and make well-considered decisions with our Ratings Table.
Stay up to date on Carlyle Group analyst ratings.
Delving into Carlyle Group's Background
Carlyle Group is one of the world's largest alternative-asset managers, with $465 billion in total AUM, including $325 billion in fee-earning AUM, at the end of June 2025. The company has three core business segments: global private equity, which includes its private equity, real estate, infrastructure, and natural resources offerings (with $165 billion in total AUM and $102 billion in fee-earning AUM), global credit ($203 billion/$163 billion), and investment/fund solutions, known as Carlyle AlphInvest ($97 billion/$60 billion). The firm primarily serves institutional investors and high-net-worth individuals. Carlyle operates through 29 offices across five continents, serving more than 3,100 active carry fund investors from 87 countries.
Carlyle Group's Economic Impact: An Analysis
Market Capitalization Analysis: Below industry benchmarks, the company's market capitalization reflects a smaller scale relative to peers. This could be attributed to factors such as growth expectations or operational capacity.
Revenue Growth: Over the 3M period, Carlyle Group showcased positive performance, achieving a revenue growth rate of 32.44% as of 30 June, 2025. This reflects a substantial increase in the company's top-line earnings. As compared to its peers, the company achieved a growth rate higher than the average among peers in Financials sector.
Net Margin: Carlyle Group's financial strength is reflected in its exceptional net margin, which exceeds industry averages. With a remarkable net margin of 32.71%, the company showcases strong profitability and effective cost management.
Return on Equity (ROE): The company's ROE is a standout performer, exceeding industry averages. With an impressive ROE of 5.59%, the company showcases effective utilization of equity capital.
Return on Assets (ROA): Carlyle Group's ROA surpasses industry standards, highlighting the company's exceptional financial performance. With an impressive 1.3% ROA, the company effectively utilizes its assets for optimal returns.
Debt Management: With a high debt-to-equity ratio of 1.83, Carlyle Group faces challenges in effectively managing its debt levels, indicating potential financial strain.
The Basics of Analyst Ratings
Analysts are specialists within banking and financial systems that typically report for specific stocks or within defined sectors. These people research company financial statements, sit in conference calls and meetings, and speak with relevant insiders to determine what are known as analyst ratings for stocks. Typically, analysts will rate each stock once a quarter.
Some analysts publish their predictions for metrics such as growth estimates, earnings, and revenue to provide additional guidance with their ratings. When using analyst ratings, it is important to keep in mind that stock and sector analysts are also human and are only offering their opinions to investors.
If you want to keep track of which analysts are outperforming others, you can view updated analyst ratings along withanalyst success scores in Benzinga Pro.
Which Stocks Are Analysts Recommending Now?
Benzinga Edge gives you instant access to all major analyst upgrades, downgrades, and price targets. Sort by accuracy, upside potential, and more. Click here to stay ahead of the market.
This article was generated by Benzinga's automated content engine and reviewed by an editor.
Posted In: CG


