Forecasting The Future: 14 Analyst Projections For Gap
Author: Benzinga Insights | September 16, 2025 04:01pm
In the preceding three months, 14 analysts have released ratings for Gap (NYSE:GAP), presenting a wide array of perspectives from bullish to bearish.
Summarizing their recent assessments, the table below illustrates the evolving sentiments in the past 30 days and compares them to the preceding months.
|
Bullish |
Somewhat Bullish |
Indifferent |
Somewhat Bearish |
Bearish |
| Total Ratings |
1 |
5 |
8 |
0 |
0 |
| Last 30D |
0 |
1 |
0 |
0 |
0 |
| 1M Ago |
0 |
2 |
8 |
0 |
0 |
| 2M Ago |
1 |
2 |
0 |
0 |
0 |
| 3M Ago |
0 |
0 |
0 |
0 |
0 |
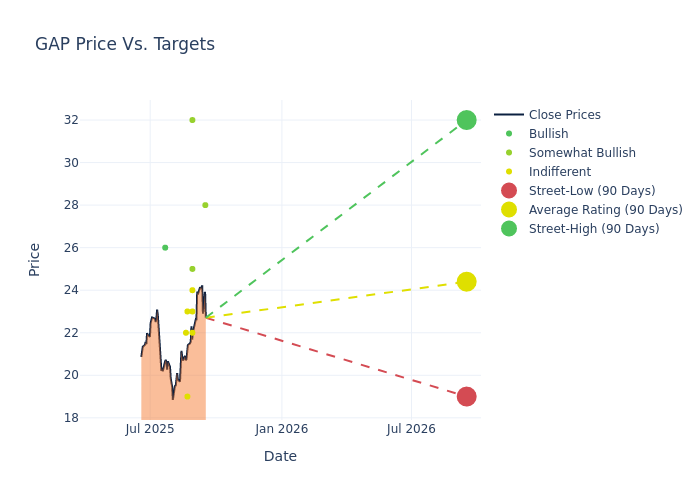
Insights from analysts' 12-month price targets are revealed, presenting an average target of $24.21, a high estimate of $32.00, and a low estimate of $19.00. This current average represents a 8.4% decrease from the previous average price target of $26.43.
Exploring Analyst Ratings: An In-Depth Overview
In examining recent analyst actions, we gain insights into how financial experts perceive Gap. The following summary outlines key analysts, their recent evaluations, and adjustments to ratings and price targets.
| Analyst |
Analyst Firm |
Action Taken |
Rating |
Current Price Target |
Prior Price Target |
| Alex Straton |
Morgan Stanley |
Raises |
Overweight |
$28.00 |
$27.00 |
| Matthew Boss |
JP Morgan |
Raises |
Overweight |
$32.00 |
$29.00 |
| Ike Boruchow |
Wells Fargo |
Lowers |
Equal-Weight |
$22.00 |
$24.00 |
| Michael Binetti |
Evercore ISI Group |
Raises |
Outperform |
$25.00 |
$24.00 |
| Dana Telsey |
Telsey Advisory Group |
Lowers |
Market Perform |
$24.00 |
$26.00 |
| Lorraine Hutchinson |
B of A Securities |
Raises |
Neutral |
$23.00 |
$21.00 |
| Dana Telsey |
Telsey Advisory Group |
Maintains |
Market Perform |
$26.00 |
$26.00 |
| Jay Sole |
UBS |
Lowers |
Neutral |
$23.00 |
$27.00 |
| Adrienne Yih |
Barclays |
Lowers |
Equal-Weight |
$19.00 |
$24.00 |
| Paul Lejuez |
Citigroup |
Lowers |
Neutral |
$22.00 |
$30.00 |
| Lorraine Hutchinson |
B of A Securities |
Lowers |
Neutral |
$21.00 |
$25.00 |
| Adrienne Yih |
Barclays |
Lowers |
Overweight |
$24.00 |
$32.00 |
| Michael Binetti |
Evercore ISI Group |
Lowers |
Outperform |
$24.00 |
$27.00 |
| Brooke Roach |
Goldman Sachs |
Lowers |
Buy |
$26.00 |
$28.00 |
Key Insights:
- Action Taken: Responding to changing market dynamics and company performance, analysts update their recommendations. Whether they 'Maintain', 'Raise', or 'Lower' their stance, it signifies their response to recent developments related to Gap. This offers insight into analysts' perspectives on the current state of the company.
- Rating: Unveiling insights, analysts deliver qualitative insights into stock performance, from 'Outperform' to 'Underperform'. These ratings convey expectations for the relative performance of Gap compared to the broader market.
- Price Targets: Analysts gauge the dynamics of price targets, providing estimates for the future value of Gap's stock. This comparison reveals trends in analysts' expectations over time.
For valuable insights into Gap's market performance, consider these analyst evaluations alongside crucial financial indicators. Stay well-informed and make prudent decisions using our Ratings Table.
Stay up to date on Gap analyst ratings.
Get to Know Gap Better
Gap retails apparel, accessories, and personal-care products under the Gap, Old Navy, Banana Republic, and Athleta brands. Old Navy generates more than half of Gap's sales. The firm also operates e-commerce sites, outlet stores, and specialty stores under various Gap names. Gap operates approximately 2,500 stores in North America, Europe, and Asia and franchises about 1,000 more in Asia, Europe, Latin America, and other regions. Gap was founded in 1969 and is based in San Francisco.
Key Indicators: Gap's Financial Health
Market Capitalization Analysis: Falling below industry benchmarks, the company's market capitalization reflects a reduced size compared to peers. This positioning may be influenced by factors such as growth expectations or operational capacity.
Revenue Growth: Gap's revenue growth over a period of 3M has been noteworthy. As of 31 July, 2025, the company achieved a revenue growth rate of approximately 0.13%. This indicates a substantial increase in the company's top-line earnings. As compared to its peers, the revenue growth lags behind its industry peers. The company achieved a growth rate lower than the average among peers in Consumer Discretionary sector.
Net Margin: Gap's net margin is impressive, surpassing industry averages. With a net margin of 5.8%, the company demonstrates strong profitability and effective cost management.
Return on Equity (ROE): The company's ROE is a standout performer, exceeding industry averages. With an impressive ROE of 6.4%, the company showcases effective utilization of equity capital.
Return on Assets (ROA): Gap's ROA surpasses industry standards, highlighting the company's exceptional financial performance. With an impressive 1.82% ROA, the company effectively utilizes its assets for optimal returns.
Debt Management: With a high debt-to-equity ratio of 1.63, Gap faces challenges in effectively managing its debt levels, indicating potential financial strain.
What Are Analyst Ratings?
Analysts are specialists within banking and financial systems that typically report for specific stocks or within defined sectors. These people research company financial statements, sit in conference calls and meetings, and speak with relevant insiders to determine what are known as analyst ratings for stocks. Typically, analysts will rate each stock once a quarter.
In addition to their assessments, some analysts extend their insights by offering predictions for key metrics such as earnings, revenue, and growth estimates. This supplementary information provides further guidance for traders. It is crucial to recognize that, despite their specialization, analysts are human and can only provide forecasts based on their beliefs.
Which Stocks Are Analysts Recommending Now?
Benzinga Edge gives you instant access to all major analyst upgrades, downgrades, and price targets. Sort by accuracy, upside potential, and more. Click here to stay ahead of the market.
This article was generated by Benzinga's automated content engine and reviewed by an editor.
Posted In: GAP


