Analyst Expectations For Lear's Future
Author: Benzinga Insights | September 25, 2025 02:01pm
In the preceding three months, 8 analysts have released ratings for Lear (NYSE: LEA), presenting a wide array of perspectives from bullish to bearish.
Summarizing their recent assessments, the table below illustrates the evolving sentiments in the past 30 days and compares them to the preceding months.
|
Bullish |
Somewhat Bullish |
Indifferent |
Somewhat Bearish |
Bearish |
| Total Ratings |
1 |
0 |
7 |
0 |
0 |
| Last 30D |
0 |
0 |
1 |
0 |
0 |
| 1M Ago |
0 |
0 |
2 |
0 |
0 |
| 2M Ago |
0 |
0 |
1 |
0 |
0 |
| 3M Ago |
1 |
0 |
3 |
0 |
0 |
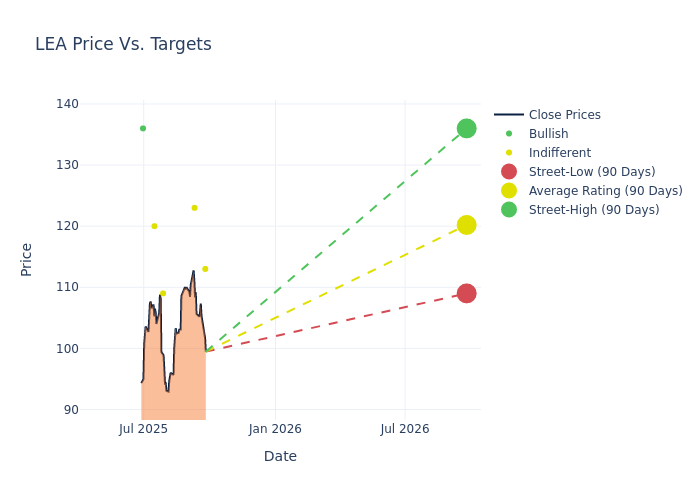
The 12-month price targets, analyzed by analysts, offer insights with an average target of $116.38, a high estimate of $136.00, and a low estimate of $103.00. This current average reflects an increase of 5.56% from the previous average price target of $110.25.
Analyzing Analyst Ratings: A Detailed Breakdown
The standing of Lear among financial experts becomes clear with a thorough analysis of recent analyst actions. The summary below outlines key analysts, their recent evaluations, and adjustments to ratings and price targets.
| Analyst |
Analyst Firm |
Action Taken |
Rating |
Current Price Target |
Prior Price Target |
| Colin Langan |
Wells Fargo |
Raises |
Equal-Weight |
$113.00 |
$111.00 |
| Federico Merendi |
B of A Securities |
Lowers |
Neutral |
$123.00 |
$135.00 |
| Colin Langan |
Wells Fargo |
Raises |
Equal-Weight |
$111.00 |
$102.00 |
| Joseph Spak |
UBS |
Lowers |
Neutral |
$109.00 |
$116.00 |
| Dan Levy |
Barclays |
Raises |
Equal-Weight |
$120.00 |
$100.00 |
| Joseph Spak |
UBS |
Raises |
Neutral |
$116.00 |
$95.00 |
| Colin Langan |
Wells Fargo |
Raises |
Equal-Weight |
$103.00 |
$100.00 |
| Michael Ward |
Citigroup |
Raises |
Buy |
$136.00 |
$123.00 |
Key Insights:
- Action Taken: Analysts respond to changes in market conditions and company performance, frequently updating their recommendations. Whether they 'Maintain', 'Raise' or 'Lower' their stance, it reflects their reaction to recent developments related to Lear. This information offers a snapshot of how analysts perceive the current state of the company.
- Rating: Gaining insights, analysts provide qualitative assessments, ranging from 'Outperform' to 'Underperform'. These ratings reflect expectations for the relative performance of Lear compared to the broader market.
- Price Targets: Gaining insights, analysts provide estimates for the future value of Lear's stock. This comparison reveals trends in analysts' expectations over time.
Navigating through these analyst evaluations alongside other financial indicators can contribute to a holistic understanding of Lear's market standing. Stay informed and make data-driven decisions with our Ratings Table.
Stay up to date on Lear analyst ratings.
Get to Know Lear Better
Lear Corp designs, develops, and manufactures automotive seating and electrical systems and components. The company has two reporting segments Seating and E-Systems. Seating components include frames and mechanisms, covers (leather and woven fabric), seat heating and cooling, foam, and headrests. Automotive electrical distribution and connection systems and electronic systems include wiring harnesses, terminals and connectors, on-board battery chargers, high-voltage battery management systems. The company earns majority of its revenue from the seating segment.
Unraveling the Financial Story of Lear
Market Capitalization Analysis: With a profound presence, the company's market capitalization is above industry averages. This reflects substantial size and strong market recognition.
Negative Revenue Trend: Examining Lear's financials over 3M reveals challenges. As of 30 June, 2025, the company experienced a decline of approximately -47.97% in revenue growth, reflecting a decrease in top-line earnings. As compared to its peers, the revenue growth lags behind its industry peers. The company achieved a growth rate lower than the average among peers in Consumer Discretionary sector.
Net Margin: Lear's net margin surpasses industry standards, highlighting the company's exceptional financial performance. With an impressive 2.74% net margin, the company effectively manages costs and achieves strong profitability.
Return on Equity (ROE): The company's ROE is a standout performer, exceeding industry averages. With an impressive ROE of 3.39%, the company showcases effective utilization of equity capital.
Return on Assets (ROA): The company's ROA is below industry benchmarks, signaling potential difficulties in efficiently utilizing assets. With an ROA of 1.1%, the company may need to address challenges in generating satisfactory returns from its assets.
Debt Management: Lear's debt-to-equity ratio is below industry norms, indicating a sound financial structure with a ratio of 0.55.
The Basics of Analyst Ratings
Benzinga tracks 150 analyst firms and reports on their stock expectations. Analysts typically arrive at their conclusions by predicting how much money a company will make in the future, usually the upcoming five years, and how risky or predictable that company's revenue streams are.
Analysts attend company conference calls and meetings, research company financial statements, and communicate with insiders to publish their ratings on stocks. Analysts typically rate each stock once per quarter or whenever the company has a major update.
Beyond their standard evaluations, some analysts contribute predictions for metrics like growth estimates, earnings, and revenue, furnishing investors with additional guidance. Users of analyst ratings should be mindful that this specialized advice is shaped by human perspectives and may be subject to variability.
Breaking: Wall Street's Next Big Mover
Benzinga's #1 analyst just identified a stock poised for explosive growth. This under-the-radar company could surge 200%+ as major market shifts unfold. Click here for urgent details.
This article was generated by Benzinga's automated content engine and reviewed by an editor.
Posted In: LEA


