A Glimpse of Jefferies Financial Gr's Earnings Potential
Author: Benzinga Insights | September 26, 2025 10:00am
Jefferies Financial Gr (NYSE: JEF) is gearing up to announce its quarterly earnings on Monday, 2025-09-29. Here's a quick overview of what investors should know before the release.
Analysts are estimating that Jefferies Financial Gr will report an earnings per share (EPS) of $0.80.
Investors in Jefferies Financial Gr are eagerly awaiting the company's announcement, hoping for news of surpassing estimates and positive guidance for the next quarter.
It's worth noting for new investors that stock prices can be heavily influenced by future projections rather than just past performance.
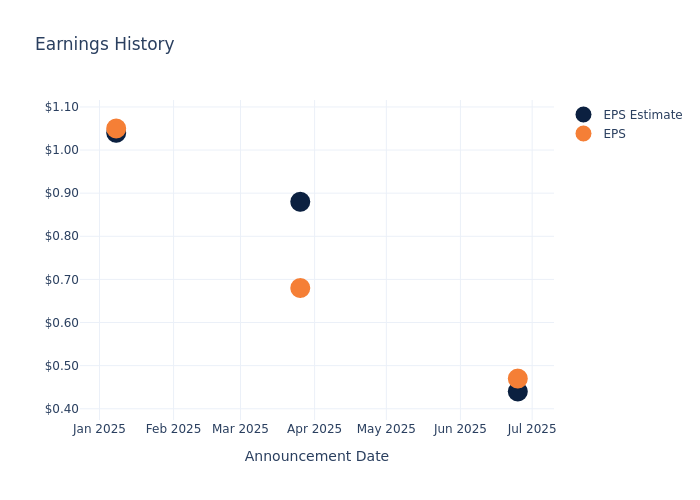
Performance in Previous Earnings
The company's EPS beat by $0.03 in the last quarter, leading to a 0.3% increase in the share price on the following day.
Here's a look at Jefferies Financial Gr's past performance and the resulting price change:
| Quarter |
Q2 2025 |
Q1 2025 |
Q4 2024 |
Q3 2024 |
| EPS Estimate |
0.44 |
0.88 |
1.04 |
0.77 |
| EPS Actual |
0.47 |
0.68 |
1.05 |
0.78 |
| Price Change % |
0.00% |
-10.00% |
1.00% |
-1.00% |
Tracking Jefferies Financial Gr's Stock Performance
Shares of Jefferies Financial Gr were trading at $65.93 as of September 25. Over the last 52-week period, shares are up 8.21%. Given that these returns are generally positive, long-term shareholders are likely bullish going into this earnings release.
Analysts' Take on Jefferies Financial Gr
For investors, staying informed about market sentiments and expectations in the industry is paramount. This analysis provides an exploration of the latest insights on Jefferies Financial Gr.
A total of 1 analyst ratings have been received for Jefferies Financial Gr, with the consensus rating being Neutral. The average one-year price target stands at $72.0, suggesting a potential 9.21% upside.
Analyzing Analyst Ratings Among Peers
In this comparison, we explore the analyst ratings and average 1-year price targets of Houlihan Lokey, XP and Moelis, three prominent industry players, offering insights into their relative performance expectations and market positioning.
- Analysts currently favor an Outperform trajectory for Houlihan Lokey, with an average 1-year price target of $218.0, suggesting a potential 230.65% upside.
- Analysts currently favor an Buy trajectory for XP, with an average 1-year price target of $23.0, suggesting a potential 65.11% downside.
- Analysts currently favor an Outperform trajectory for Moelis, with an average 1-year price target of $81.0, suggesting a potential 22.86% upside.
Peer Analysis Summary
The peer analysis summary presents essential metrics for Houlihan Lokey, XP and Moelis, unveiling their respective standings within the industry and providing valuable insights into their market positions and comparative performance.
| Company |
Consensus |
Revenue Growth |
Gross Profit |
Return on Equity |
| Jefferies Financial Gr |
Neutral |
-0.87% |
$1.47B |
0.86% |
| Houlihan Lokey |
Outperform |
17.86% |
$233.06M |
4.48% |
| XP |
Buy |
-7.91% |
$368.94M |
6.09% |
| Moelis |
Outperform |
38.09% |
$113.27M |
8.30% |
Key Takeaway:
Jefferies Financial Gr ranks at the bottom for Revenue Growth and Gross Profit among its peers. It is in the middle for Return on Equity.
All You Need to Know About Jefferies Financial Gr
Jefferies is a full-service investment banking and capital markets firm that was founded in 1962. After nearly 30 years of focusing on institutional trading services, it entered the investment banking industry in the early 1990s, which ultimately grew into the core business. In 2013, Jefferies merged with Leucadia, a manufacturing-focused holding company. Since merging, Jefferies became the bedrock of the business as the bulk of the legacy portfolio was sold off and the parent company was renamed to match the subsidiary. Within the investment banking landscape, Jefferies predominately serves the North American middle market and has captured considerable market share over the past decade.
Financial Milestones: Jefferies Financial Gr's Journey
Market Capitalization Analysis: Positioned below industry benchmarks, the company's market capitalization faces constraints in size. This could be influenced by factors such as growth expectations or operational capacity.
Decline in Revenue: Over the 3 months period, Jefferies Financial Gr faced challenges, resulting in a decline of approximately -0.87% in revenue growth as of 31 May, 2025. This signifies a reduction in the company's top-line earnings. When compared to others in the Financials sector, the company faces challenges, achieving a growth rate lower than the average among peers.
Net Margin: Jefferies Financial Gr's net margin falls below industry averages, indicating challenges in achieving strong profitability. With a net margin of 3.53%, the company may face hurdles in effective cost management.
Return on Equity (ROE): Jefferies Financial Gr's ROE is below industry averages, indicating potential challenges in efficiently utilizing equity capital. With an ROE of 0.86%, the company may face hurdles in achieving optimal financial returns.
Return on Assets (ROA): Jefferies Financial Gr's ROA lags behind industry averages, suggesting challenges in maximizing returns from its assets. With an ROA of 0.13%, the company may face hurdles in achieving optimal financial performance.
Debt Management: With a below-average debt-to-equity ratio of 2.23, Jefferies Financial Gr adopts a prudent financial strategy, indicating a balanced approach to debt management.
To track all earnings releases for Jefferies Financial Gr visit their earnings calendar on our site.
This article was generated by Benzinga's automated content engine and reviewed by an editor.
Posted In: JEF


