Stock Market Today: S&P 500, Dow, Nasdaq Futures Decline Following Government Shutdown—Nike, Ryvyl, Conagra Brands In Focus
Author: Rishabh Mishra | October 01, 2025 08:29am
Editor’s Note: The future prices of benchmark tracking ETFs, the lede, and the latest economic releases were updated in the story.
U.S. stock futures tumbled on Wednesday following Tuesday's advances. Futures of major benchmark indices were lower.
Based on the latest ADP National Employment Report, the U.S. private sector saw a loss of 32,000 jobs in September 2025, signaling caution among employers despite recent economic growth.
This decline was driven by small and medium-sized businesses, which shed 40,000 and 20,000 jobs respectively, while large establishments added 33,000 positions. The service-providing sector accounted for the bulk of the losses with a decrease of 28,000 jobs. Meanwhile, annual pay for those remaining in their jobs grew by a steady 4.5%.
The indices dropped as the U.S. federal government officially entered a shutdown at 12:01 a.m. on Wednesday, Oct. 1, after Congress failed to reach an agreement on a spending plan.
However, historical data suggests that these events are often short-lived and have a limited long-term impact on equities.
Meanwhile, the 10-year Treasury bond yielded 4.15% and the two-year bond was at 3.60%. The CME Group's FedWatch tool‘s projections show markets pricing a 94.6% likelihood of the Federal Reserve cutting the current interest rates in its October meeting.
Futures
Change (+/-)
Dow Jones
-0.56%
S&P 500
-0.65%
Nasdaq 100
-0.73%
Russell 2000
-0.70%
The SPDR S&P 500 ETF Trust (NYSE:SPY) and Invesco QQQ Trust ETF (NASDAQ:QQQ), which track the S&P 500 index and Nasdaq 100 index, respectively, fell in premarket on Wednesday. The SPY was down 0.40% at $663.50, while the QQQ declined 0.45% to $597.69, according to Benzinga Pro data.
Cues From Last Session
Most sectors on the S&P 500 closed on a positive note, with information technology, health care, and industrials stocks recording the biggest gains on Tuesday. However, energy and consumer discretionary stocks bucked the overall market trend, closing the session lower. U.S. stocks still settled higher as the Dow Jones surged to a new closing high.
The government shutdown comes after major indices recorded gains last month; the S&P 500 gained more than 3% in September, the Dow added almost 2%, and the Nasdaq jumped 5.6% during the month.
On the economic front, U.S. job openings rose by 19,000 to 7.227 million in August from a revised 7.208 million. The Chicago Business Barometer declined to 40.6 in September from 41.5 in the previous month, compared to market expectations of 43. The S&P CoreLogic Case-Shiller Home Price Index increased 1.8% year-over-year in July.
The Dow Jones index ended 82 points or 0.18% higher at 46,397.89, whereas the S&P 500 index rose 0.41% to 6,688.46. Nasdaq Composite advanced 0.30% to 22,660.01, and the small-cap gauge, Russell 2000, gained 0.051% to end at 2,436.48.
Index
Performance (+/-)
Value
Nasdaq Composite
0.30%
22,660.01
S&P 500
0.41%
6,688.46
Dow Jones
0.18%
46,397.89
Russell 2000
0.051%
2,436.48
Insights From Analysts
The stock market successfully navigated a historically tricky September, concluding the month with a handsome gain of over 3% and continuing its recent “melt-up.”
As the calendar flips to October, and the government shutdown is a near-term hiccup for markets, investors need to know whether this powerful momentum can be sustained. According to a recent analysis by Portfolio Strategist George Smith, historical trends suggest the outlook is more of a “treat” than a “trick.”
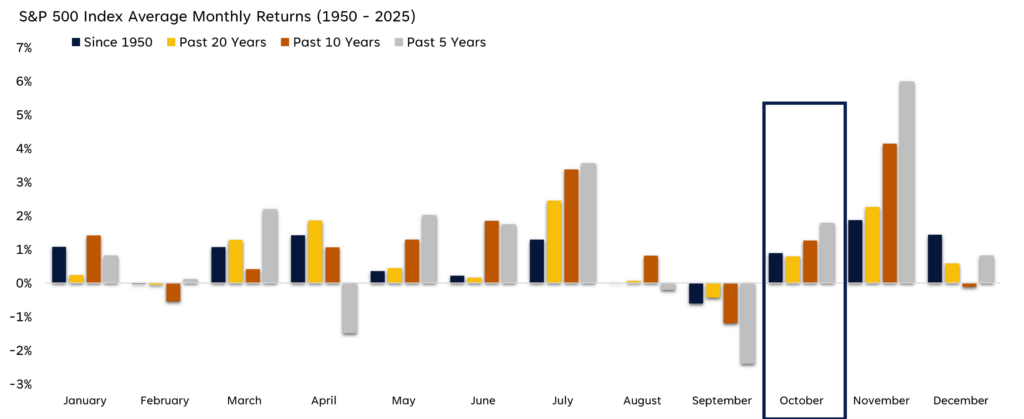
While October is often associated with spooky market crashes of the past, its overall history is surprisingly positive. Smith’s analysis highlights that since 1950, the S&P 500 has posted positive returns in October nearly 60% of the time, with an average gain of 0.89%.
A key concern might be that September’s strong performance “pulled forward” gains from October. However, the data does not support this fear. The average return for an October that follows a positive September is nearly identical at 0.8%.
The chart by LPL Research, FactSet, and Bloomberg attached below visualizes monthly performance, showing that while September is often weak, October and November have historically delivered solid gains, especially in more recent periods.
Source: LPL Research, FactSet, and Bloomberg
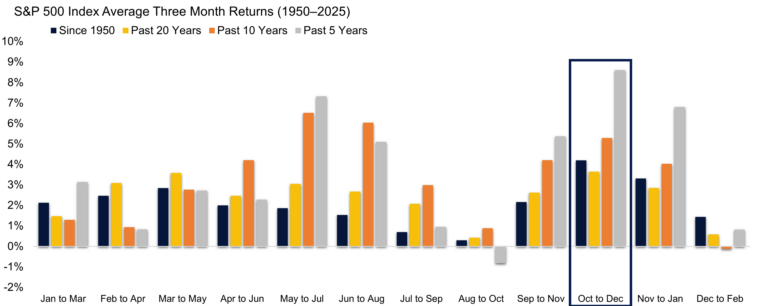
Looking beyond just one month, the entire fourth quarter (October to December) stands out as the strongest three-month period of the year for equities.
Since 1950, the fourth quarter has delivered a combined average return of almost 2%.
Over the past five years, that average return has surged to over 6%.
This trend, often boosted by a “Santa Claus Rally” in December, underscores a period of historical strength that the market is just now entering. The chart tracking three-month returns clearly shows the October-to-December period as the peak performer across all measured timeframes.
Beyond seasonality, the market’s current momentum provides another compelling bullish signal. The S&P 500 is set to close out its fifth consecutive winning month, a relatively rare event.
Smith’s research on these hot streaks reveals powerful historical precedents:
This marks the 33rd time since 1950 that the S&P 500 has had a winning streak of five or more months.
In the past, these streaks rarely stopped at just five months.
The average one-year forward return following a five-month streak is 13%, significantly above the long-term average.
Most impressively, even in the 10 instances when the streak did end at five months, the S&P 500 has never been down a year later.
In conclusion, while past performance is no guarantee of future results, the combination of favorable October seasonality, the strength of the fourth quarter, and the powerful momentum of a five-month winning streak presents a historically bullish setup for equities as we head into the final months of the year.
Here's what investors will be keeping an eye on Wednesday;
In September 2025, U.S. private sector employment fell by 32,000 jobs, while annual pay rose 4.5% for job-stayers and 6.6% for job-changers.
September’s S&P final U.S. manufacturing PMI will be released at 9:45 a.m., August’s construction spending data, and September’s ISM manufacturing data will be out by 10:00 a.m. ET.
The time for September’s auto sales data is yet to be determined.
Stocks In Focus
Conagra Brands Inc. (NYSE:CAG) was up 0.44% in premarket on Tuesday ahead of its earnings report scheduled to be released before the opening bell. Analysts estimate earnings of 33 cents per share on revenue of $2.62 billion.
RPM International Inc. (NYSE:RPM) was up 0.53% as analysts estimate earnings of $1.88 per share on revenue of $2.06 billion before the opening bell.
Acuity Inc. (NYSE:AYI) rose 1.40% ahead of its earnings report scheduled to be released before the opening bell. Analysts estimate earnings of $4.84 per share on revenue of $1.23 billion.
Nike Inc. (NYSE:NKE) rose 3.26% after reporting better-than-expected first-quarter financial results. Its quarterly earnings of 49 cents per share beat the analyst consensus estimate of 27 cents, and sales of $11.720 billion beat the estimate of $11.000 billion.
Ryvyl Inc. (NASDAQ:RVYL) surged 94.66% after announcing a $75 million merger agreement with RTB Digital.
AST SpaceMobile Inc. (NASDAQ:ASTS) jumped 6.38% following news about the company’s upcoming satellite BlueBird 6‘s launch schedule.
Iron Horse Acquisitions Corp. (NASDAQ:IROHW) popped 47.43% following the company's announcement that it had finalized its business merger with Rosey Sea Holdings Limited and China Food Investment (CFI).
3 E Network Technology Group Ltd. (NASDAQ:MASK) climbed up 15.51% despite recent regulatory challenges from Nasdaq.
Robo.ai Inc. (NASDAQ:AIIO) was unchanged after jumping nearly 36% on Tuesday as the company revealed a $300 million investment commitment from a consortium led by Burkhan Capital LLC, a UAE-based company, according to a joint statement.
Commodities, Gold, And Global Equity Markets
Crude oil futures were trading lower in the early New York session by 0.22% to hover around $62.23 per barrel.
Gold Spot US Dollar rose 0.86% to hover around $3,891.64 per ounce. Its last record high stood at $3,895.33 per ounce. The U.S. Dollar Index spot was 0.24% lower at the 97.5400 level.
Asian markets closed mixed on Wednesday, as Japan's Nikkei 225 and Australia's ASX 200 indices fell. Whereas, South Korea's Kospi, Hong Kong's Hang Seng, China’s CSI 300, and India’s S&P BSE Sensex indices rose. European markets were also mixed in early trade.


 https://editorial-assets.benzinga.com/wp-content/uploads/2025/10/01045557/PIC-2-2-300x119.png 300w,
