A Glimpse Into The Expert Outlook On Aflac Through 7 Analysts
Author: Benzinga Insights | October 08, 2025 02:01pm
In the last three months, 7 analysts have published ratings on Aflac (NYSE:AFL), offering a diverse range of perspectives from bullish to bearish.
Summarizing their recent assessments, the table below illustrates the evolving sentiments in the past 30 days and compares them to the preceding months.
|
Bullish |
Somewhat Bullish |
Indifferent |
Somewhat Bearish |
Bearish |
| Total Ratings |
0 |
0 |
5 |
2 |
0 |
| Last 30D |
0 |
0 |
0 |
1 |
0 |
| 1M Ago |
0 |
0 |
0 |
0 |
0 |
| 2M Ago |
0 |
0 |
3 |
1 |
0 |
| 3M Ago |
0 |
0 |
2 |
0 |
0 |
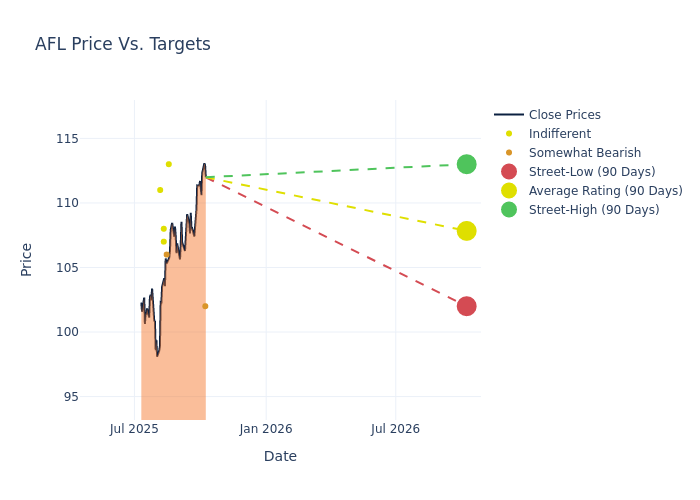
Analysts have set 12-month price targets for Aflac, revealing an average target of $107.86, a high estimate of $113.00, and a low estimate of $102.00. Marking an increase of 1.62%, the current average surpasses the previous average price target of $106.14.
Understanding Analyst Ratings: A Comprehensive Breakdown
The analysis of recent analyst actions sheds light on the perception of Aflac by financial experts. The following summary presents key analysts, their recent evaluations, and adjustments to ratings and price targets.
| Analyst |
Analyst Firm |
Action Taken |
Rating |
Current Price Target |
Prior Price Target |
| Alex Scott |
Barclays |
Raises |
Underweight |
$102.00 |
$100.00 |
| Nigel Dally |
Morgan Stanley |
Raises |
Equal-Weight |
$113.00 |
$108.00 |
| Thomas Gallagher |
Evercore ISI Group |
Raises |
Underperform |
$106.00 |
$105.00 |
| Elyse Greenspan |
Wells Fargo |
Raises |
Equal-Weight |
$107.00 |
$105.00 |
| Ryan Krueger |
Keefe, Bruyette & Woods |
Raises |
Market Perform |
$108.00 |
$106.00 |
| Brian Meredith |
UBS |
Lowers |
Neutral |
$111.00 |
$114.00 |
| Nigel Dally |
Morgan Stanley |
Raises |
Equal-Weight |
$108.00 |
$105.00 |
Key Insights:
- Action Taken: Analysts adapt their recommendations to changing market conditions and company performance. Whether they 'Maintain', 'Raise' or 'Lower' their stance, it reflects their response to recent developments related to Aflac. This information provides a snapshot of how analysts perceive the current state of the company.
- Rating: Offering a comprehensive view, analysts assess stocks qualitatively, spanning from 'Outperform' to 'Underperform'. These ratings convey expectations for the relative performance of Aflac compared to the broader market.
- Price Targets: Analysts navigate through adjustments in price targets, providing estimates for Aflac's future value. Comparing current and prior targets offers insights into analysts' evolving expectations.
Capture valuable insights into Aflac's market standing by understanding these analyst evaluations alongside pertinent financial indicators. Stay informed and make strategic decisions with our Ratings Table.
Stay up to date on Aflac analyst ratings.
About Aflac
Aflac Inc offers supplemental health insurance and life insurance in the United States and Japan. In addition to its cancer policies, the company has broadened its product offerings to include accident, dental and vision, disability, and long-term-care insurance. It markets its products through independent distributors, selling the majority of its policies directly to consumers at their places of work, and also reaches out to its customers outside of their worksite through digital mediums. The company has two reportable business segments; Aflac Japan which generates the majority of the revenue, and Aflac U.S.
Aflac's Financial Performance
Market Capitalization Highlights: Above the industry average, the company's market capitalization signifies a significant scale, indicating strong confidence and market prominence.
Revenue Growth: Aflac's revenue growth over a period of 3M has faced challenges. As of 30 June, 2025, the company experienced a revenue decline of approximately -18.21%. This indicates a decrease in the company's top-line earnings. As compared to competitors, the company encountered difficulties, with a growth rate lower than the average among peers in the Financials sector.
Net Margin: Aflac's net margin surpasses industry standards, highlighting the company's exceptional financial performance. With an impressive 14.2% net margin, the company effectively manages costs and achieves strong profitability.
Return on Equity (ROE): Aflac's ROE stands out, surpassing industry averages. With an impressive ROE of 2.24%, the company demonstrates effective use of equity capital and strong financial performance.
Return on Assets (ROA): Aflac's financial strength is reflected in its exceptional ROA, which exceeds industry averages. With a remarkable ROA of 0.49%, the company showcases efficient use of assets and strong financial health.
Debt Management: Aflac's debt-to-equity ratio is below industry norms, indicating a sound financial structure with a ratio of 0.33.
Analyst Ratings: What Are They?
Analyst ratings serve as essential indicators of stock performance, provided by experts in banking and financial systems. These specialists diligently analyze company financial statements, participate in conference calls, and engage with insiders to generate quarterly ratings for individual stocks.
Some analysts publish their predictions for metrics such as growth estimates, earnings, and revenue to provide additional guidance with their ratings. When using analyst ratings, it is important to keep in mind that stock and sector analysts are also human and are only offering their opinions to investors.
If you want to keep track of which analysts are outperforming others, you can view updated analyst ratings along withanalyst success scores in Benzinga Pro.
Which Stocks Are Analysts Recommending Now?
Benzinga Edge gives you instant access to all major analyst upgrades, downgrades, and price targets. Sort by accuracy, upside potential, and more. Click here to stay ahead of the market.
This article was generated by Benzinga's automated content engine and reviewed by an editor.
Posted In: AFL


