Beyond The Numbers: 8 Analysts Discuss Casey's General Stores Stock
Author: Benzinga Insights | October 08, 2025 03:00pm
Casey's General Stores (NASDAQ:CASY) underwent analysis by 8 analysts in the last quarter, revealing a spectrum of viewpoints from bullish to bearish.
The following table summarizes their recent ratings, shedding light on the changing sentiments within the past 30 days and comparing them to the preceding months.
|
Bullish |
Somewhat Bullish |
Indifferent |
Somewhat Bearish |
Bearish |
| Total Ratings |
1 |
5 |
2 |
0 |
0 |
| Last 30D |
0 |
1 |
0 |
0 |
0 |
| 1M Ago |
1 |
3 |
2 |
0 |
0 |
| 2M Ago |
0 |
0 |
0 |
0 |
0 |
| 3M Ago |
0 |
1 |
0 |
0 |
0 |
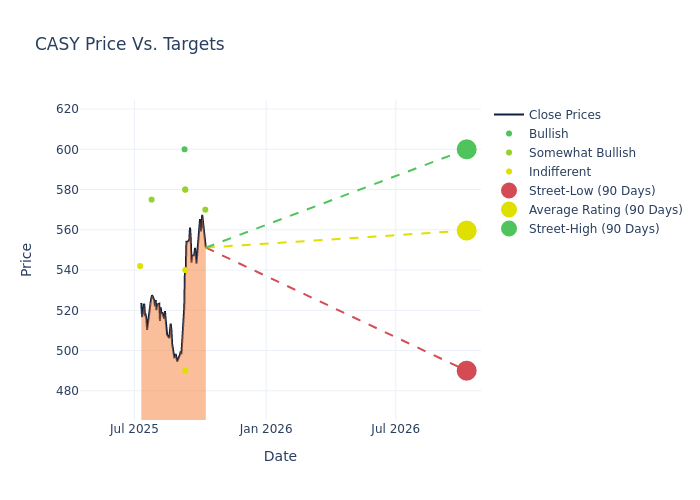
Providing deeper insights, analysts have established 12-month price targets, indicating an average target of $558.12, along with a high estimate of $600.00 and a low estimate of $490.00. This upward trend is apparent, with the current average reflecting a 4.08% increase from the previous average price target of $536.25.
Decoding Analyst Ratings: A Detailed Look
In examining recent analyst actions, we gain insights into how financial experts perceive Casey's General Stores. The following summary outlines key analysts, their recent evaluations, and adjustments to ratings and price targets.
| Analyst |
Analyst Firm |
Action Taken |
Rating |
Current Price Target |
Prior Price Target |
| Pooran Sharma |
Stephens & Co. |
Maintains |
Overweight |
$570.00 |
$570.00 |
| Bonnie Herzog |
Goldman Sachs |
Raises |
Neutral |
$490.00 |
$450.00 |
| Anthony Bonadio |
Wells Fargo |
Raises |
Overweight |
$580.00 |
$540.00 |
| Michael Montani |
Evercore ISI Group |
Raises |
Outperform |
$580.00 |
$560.00 |
| Kelly Bania |
BMO Capital |
Raises |
Market Perform |
$540.00 |
$515.00 |
| Corey Tarlowe |
Jefferies |
Raises |
Buy |
$600.00 |
$575.00 |
| Pooran Sharma |
Stephens & Co. |
Maintains |
Overweight |
$530.00 |
$530.00 |
| Bradley Thomas |
Keybanc |
Raises |
Overweight |
$575.00 |
$550.00 |
Key Insights:
- Action Taken: Analysts respond to changes in market conditions and company performance, frequently updating their recommendations. Whether they 'Maintain', 'Raise' or 'Lower' their stance, it reflects their reaction to recent developments related to Casey's General Stores. This information offers a snapshot of how analysts perceive the current state of the company.
- Rating: Analyzing trends, analysts offer qualitative evaluations, ranging from 'Outperform' to 'Underperform'. These ratings convey expectations for the relative performance of Casey's General Stores compared to the broader market.
- Price Targets: Analysts provide insights into price targets, offering estimates for the future value of Casey's General Stores's stock. This comparison reveals trends in analysts' expectations over time.
To gain a panoramic view of Casey's General Stores's market performance, explore these analyst evaluations alongside essential financial indicators. Stay informed and make judicious decisions using our Ratings Table.
Stay up to date on Casey's General Stores analyst ratings.
About Casey's General Stores
Casey's General Stores Inc serves as convenience store chain with its 2,900 locations, positioned in the Midwest United States. About half of Casey's stores are located in rural towns with populations under 5,000. While fueling stations serve as a key traffic driver, about two-thirds of the company's gross profit stems from in-store sales of grocery items, prepared meals, and general merchandise. Casey's owns more than 90% of its stores and operates the majority of its warehousing and distribution processes internally.
Key Indicators: Casey's General Stores's Financial Health
Market Capitalization Analysis: With a profound presence, the company's market capitalization is above industry averages. This reflects substantial size and strong market recognition.
Positive Revenue Trend: Examining Casey's General Stores's financials over 3M reveals a positive narrative. The company achieved a noteworthy revenue growth rate of 11.45% as of 31 July, 2025, showcasing a substantial increase in top-line earnings. As compared to competitors, the company surpassed expectations with a growth rate higher than the average among peers in the Consumer Staples sector.
Net Margin: Casey's General Stores's net margin surpasses industry standards, highlighting the company's exceptional financial performance. With an impressive 4.72% net margin, the company effectively manages costs and achieves strong profitability.
Return on Equity (ROE): Casey's General Stores's financial strength is reflected in its exceptional ROE, which exceeds industry averages. With a remarkable ROE of 6.02%, the company showcases efficient use of equity capital and strong financial health.
Return on Assets (ROA): Casey's General Stores's financial strength is reflected in its exceptional ROA, which exceeds industry averages. With a remarkable ROA of 2.6%, the company showcases efficient use of assets and strong financial health.
Debt Management: Casey's General Stores's debt-to-equity ratio is below the industry average. With a ratio of 0.79, the company relies less on debt financing, maintaining a healthier balance between debt and equity, which can be viewed positively by investors.
Analyst Ratings: Simplified
Analysts work in banking and financial systems and typically specialize in reporting for stocks or defined sectors. Analysts may attend company conference calls and meetings, research company financial statements, and communicate with insiders to publish "analyst ratings" for stocks. Analysts typically rate each stock once per quarter.
In addition to their assessments, some analysts extend their insights by offering predictions for key metrics such as earnings, revenue, and growth estimates. This supplementary information provides further guidance for traders. It is crucial to recognize that, despite their specialization, analysts are human and can only provide forecasts based on their beliefs.
Breaking: Wall Street's Next Big Mover
Benzinga's #1 analyst just identified a stock poised for explosive growth. This under-the-radar company could surge 200%+ as major market shifts unfold. Click here for urgent details.
This article was generated by Benzinga's automated content engine and reviewed by an editor.
Posted In: CASY


