It was a pretty quiet week until Friday. Trade tensions with China are soaring again, and it sent stocks tumbling into the close. Could we really see 100% tariffs on China? I think it's an exaggeration, and the best dip buying opportunity in months. Be ready. The Dow Jones Industrial Average led the selling lower, finishing down 2.73% on the week. The S&P 500 was down 2.43% while the Nasdaq was off 2.53%. Gold and silver both hit new all-time highs last week, while bonds saw a solid bid come through. Crude oil is getting crushed and it looks like we're setting up for a great buying opportunity in crypto again.
Stocks I Like
Serve Robotics (SERV) – 53% Return Potential
What's Happening
Serve Robotics Inc. (NASDAQ:SERV) is a leading autonomous delivery company developing AI-powered sidewalk robots for last-mile logistics, offering investors exposure to the rapidly growing robotics and automation sector with a focus on sustainable, scalable delivery solutions.
The latest quarterly report from the company showed revenue of $642k but a loss of $13.97 million.
This valuation on SERV is sky-high. It doesn't have much to report in terms of earnings or assets, but they are getting more of their robots circulating.
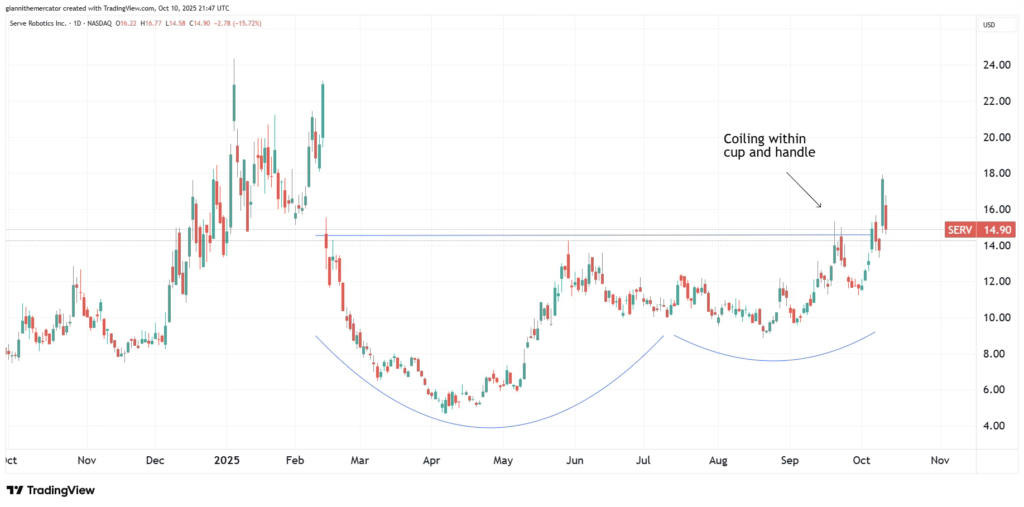
From a technical standpoint, SERV is looking to breakout from a cup and handle formation, which would lead to an acceleration in upside momentum.
Why It's Happening
Serve Robotics Inc. is revolutionizing last-mile delivery with its AI-powered sidewalk robots, capitalizing on the booming demand for efficient, eco-friendly food services. With revenue surging 46% in Q2 2025 and deliveries up 80% quarter-over-quarter, the company is building a scalable model that addresses urban logistics challenges, positioning it as a frontrunner in the shift toward autonomous urban mobility.
Strategic partnership with Uber Eats is unlocking explosive growth opportunities. The multi-year deal to deploy 2,000 Gen3 robots across major U.S. cities, including a fresh expansion into Chicago’s metro area, creates a powerful distribution network for Serve’s technology, driving higher utilization and paving the way for nationwide adoption in the $160 billion autonomous food delivery market by 2030.
Massive market potential in autonomous logistics fuels Serve’s long-term narrative. Backed by Ark Invest’s forecast of an $860 billion opportunity in robotics by 2030, the company’s focus on low-emission, AI-driven solutions taps into rising consumer preferences for sustainable delivery, with plans for $60-80 million in annualized revenue once its full fleet is operational.
Backing from tech giants strengthens Serve’s credibility and resources. With Uber Technologies and Nvidia as key investors, the company gains access to cutting-edge expertise and capital—evidenced by $167 million raised in 2024—to fuel rapid scaling, reinforcing its story as a high-potential innovator at the intersection of AI, robotics, and everyday services.
Geographic expansion and fleet growth signal accelerating momentum. From Los Angeles roots to new markets like Atlanta and Chicago, Serve’s on-track deployment of 2,000 robots by year-end 2025, including the milestone of its 1,000th unit, builds a robust operational footprint that captures increasing urban demand and sets the stage for international opportunities.
Analyst Ratings:
Wedbush: Outperform
Cantor Fitzgerald: Overweight
Northland Capital Markets: Outperform
My Action Plan (53% Return Potential)
I am bullish on SERV above $12.00-$12.50. My upside target is $23.00-$24.00.
ViaSat (VSAT) – 38% Return Potential
What's Happening
Viasat Inc. (NASDAQ:VSAT) is a leading global communications company providing high-capacity satellite broadband and wireless networking services, offering investors exposure to the rapidly growing satellite communications and connectivity sector with a focus on high-speed internet and secure solutions for consumer, commercial, and government markets.
The latest quarterly report showed revenue of $1.17 billion and earnings of $23.09 million.
Valuation is solid in this stock. Price-to-Sales is at 0.93, EV to EBITDA is at 8.47, and Book Value is 33.98.
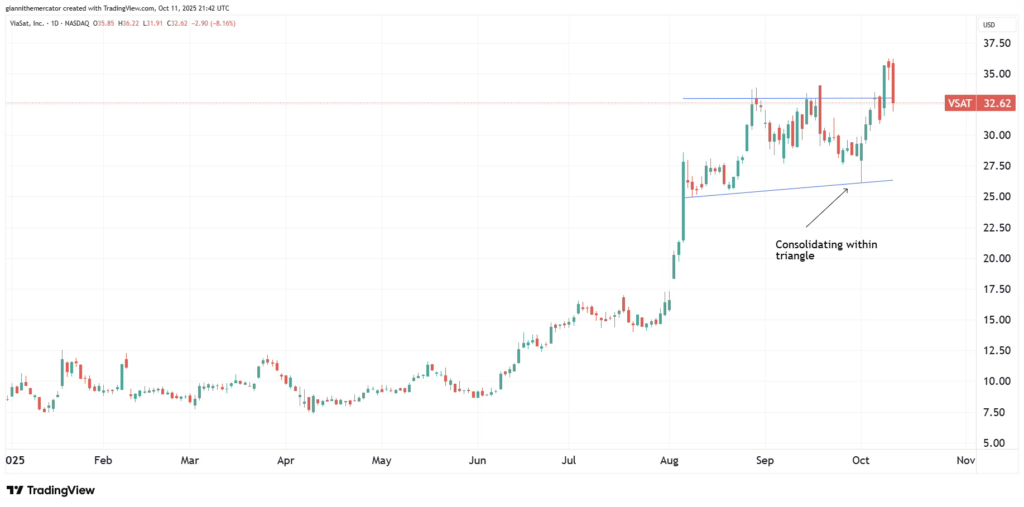
At a technical level, VSAT is coiling up nicely within an ascending triangle, which points to a continuation of the ongoing uptrend.
Why It's Happening
Viasat Inc. is poised for explosive growth in the satellite broadband arena, with the upcoming ViaSat-3 F2 launch scheduled for October 2025 set to more than double its global bandwidth capacity. This milestone builds on the transformative 2023 Inmarsat acquisition, expanding Viasat’s footprint to serve underserved regions and industries, creating a narrative of becoming the go-to provider for high-speed connectivity in remote and mobile environments.
Deep-rooted government and defense contracts anchor Viasat’s stability and revenue diversity. As a key supplier to U.S. military and intelligence agencies, the company benefits from long-term, high-margin deals that provide a defensive moat against market volatility, while enabling innovation in secure communications—positioning Viasat as an indispensable partner in national security and global defense initiatives.
Strategic joint ventures in direct-to-device services open vast new markets for Viasat. The September 2025 Equatys partnership with Space42 grants access to the world’s largest coordinated spectrum block, paving the way for seamless satellite-to-smartphone connectivity and tapping into the exploding demand for ubiquitous mobile broadband, especially in emerging economies.
Robust aviation and maritime expansions fuel Viasat’s commercial momentum. Recent rollouts like the 300+ NexusWave installations with Pulsar International and deals with major airlines enhance in-flight and at-sea connectivity, capitalizing on the post-pandemic travel boom and positioning Viasat to dominate the $10 billion+ mobility connectivity sector.
Path to financial turnaround and cash flow positivity strengthens Viasat’s long-term story. With expected free cash flow breakeven later in 2025 and a $568 million milestone payment in 2026, alongside the potential spin-off of its profitable defense unit, the company is shedding legacy burdens to unlock value and drive shareholder returns in a high-growth satellite ecosystem.
Analyst Ratings:
JP Morgan: Neutral
Needham: Buy
William Blair: Outperform
My Action Plan (38% Return Potential)
I am bullish on VSAT above $26.00-$27.00. My upside target is $45.00-$46.00.
Mind Medicine (MNMD) – 19% Return Potential
What's Happening
Mind Medicine Inc. (NASDAQ:MNMD) is a leading clinical-stage biopharmaceutical company developing psychedelic-inspired therapies for mental health and neurological disorders, offering investors exposure to the rapidly growing psychopharmacology and mental health treatment sector with a focus on innovative, evidence-based solutions for anxiety and addiction.
There's no revenue on MNMD yet. The latest quarterly report showed a loss of $42.74 million.
Valuation in MNMD is tricky due to its financial situation. It has a Book Value of 2.43. It's a very speculative play.
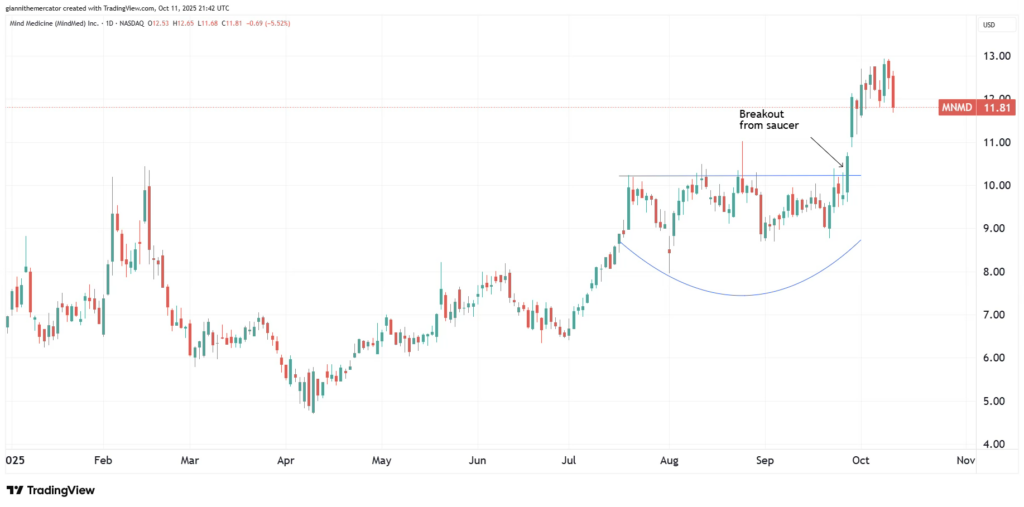
From a charting viewpoint, MNMD broke out from the saucer. It's already accelerating to the upside, showing the bullish potential.
Why It's Happening
Mind Medicine (MindMed) Inc. is pioneering the psychedelic medicine revolution, with its lead candidate MM120 (a refined LSD formulation) advancing through three pivotal Phase 3 trials for generalized anxiety disorder (GAD) and major depressive disorder (MDD). The promising Phase 2b results and a robust cash runway into 2027 position MindMed as a frontrunner in addressing the growing mental health crisis, tapping into a multi-billion-dollar market for innovative brain health treatments.
Rising political and social momentum for psychedelic therapies enhances MindMed's growth narrative. Bipartisan discussions with the U.S. Department of Veterans Affairs about expanding access to psychedelic treatments for veterans signal potential regulatory tailwinds, boosting the company's prospects for faster market entry and broader societal acceptance of its therapies.
Strategic talent acquisition and leadership strength underscore MindMed's commitment to execution. The appointment of Brandi Roberts as CFO and Matt Wiley as Chief Commercial Officer, alongside inducement grants to attract top talent, reflects a focused strategy to build a world-class team capable of navigating clinical and commercial milestones, reinforcing investor confidence in its long-term vision.
Groundbreaking research on mental health needs elevates MindMed's societal impact. A 2025 study presented at Psych Congress revealed nearly 50% of severe GAD patients experience daily suicidal ideation, spotlighting the urgent need for innovative treatments like MM120. This positions MindMed as a mission-driven company addressing critical gaps in mental health care, resonating with socially conscious investors.
My Action Plan (19% Return Potential)
I am bullish on MNMD above $9.50-$10.00. My upside target is $14.00-$15.00.
Market-Moving Catalysts for the Week Ahead
The New Economy
Artificial Intelligence. Nuclear. Quantum. Crypto. The world is changing faster than ever, and the markets are reflecting these incredible opportunities left and right. I see so much anger towards the "bubbly" price action of some of these names, but if you manage risk properly, they really offer the best opportunities to make money.
I completely understand and sympathize with the fact that the valuations in many of these companies are outrageous. Many of them don't even have revenue or earnings. But my honest response to that? So what.
Markets don't move based on facts, reason, or common sense. The sooner you accept this truth, the faster your trading results will improve. Markets move based on emotions – fear, greed, euphoria, panic. We've seen this time and time again throughout history. Manage risk properly so you can make those mini-fortunes in bubbles.
Sector & Industry Strength
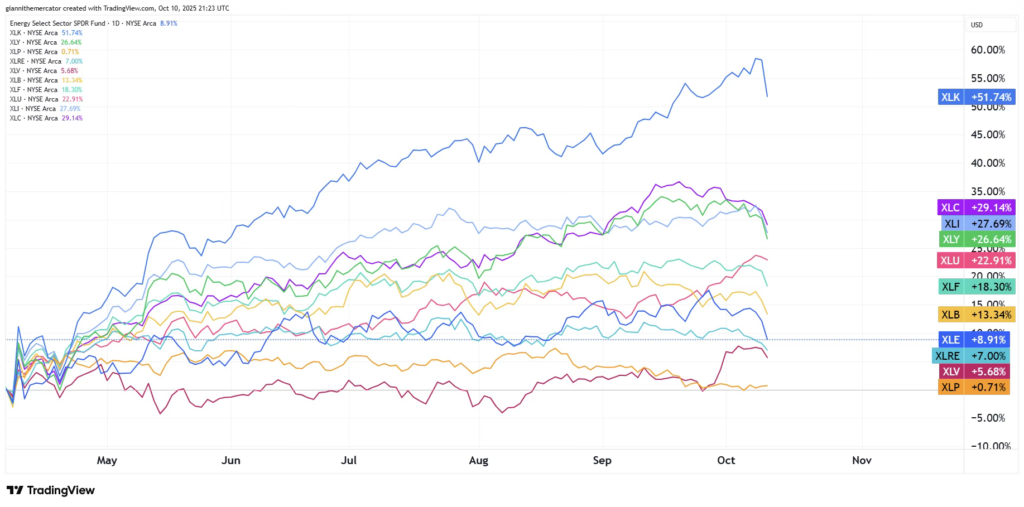
It was a bit of a battle between risk-on and risk-off sectors last week. Tech (NYSE:XLK) and utilities (NYSE:XLU) were neck and neck, but how much of the utility landscape is rising now due to growth from AI versus economic slowdown concerns?
By far and away, we still see the tech sector (XLK) as the top-performer since the April 7 low. This, in of itself, is very bullish. We're talking about a 25% point spread between tech and the second-best performer in communications (NYSE:XLC). This is huge.
Meanwhile, all of the defensively-oriented sectors like consumer staples (NYSE:XLP) and healthcare (NYSE:XLV) are still hanging out near the bottom of the pack. Let stocks chop around some in the coming days to see if the growth sectors can regain some momentum.
1 week
3 Weeks
13 Weeks
26 Weeks
Utilities
Utilities
Utilities
Technology
Editor's Note: Near-term pain. Long-term gain
The Party's Just Getting Started (Sector ETF: SMH/QQQ)
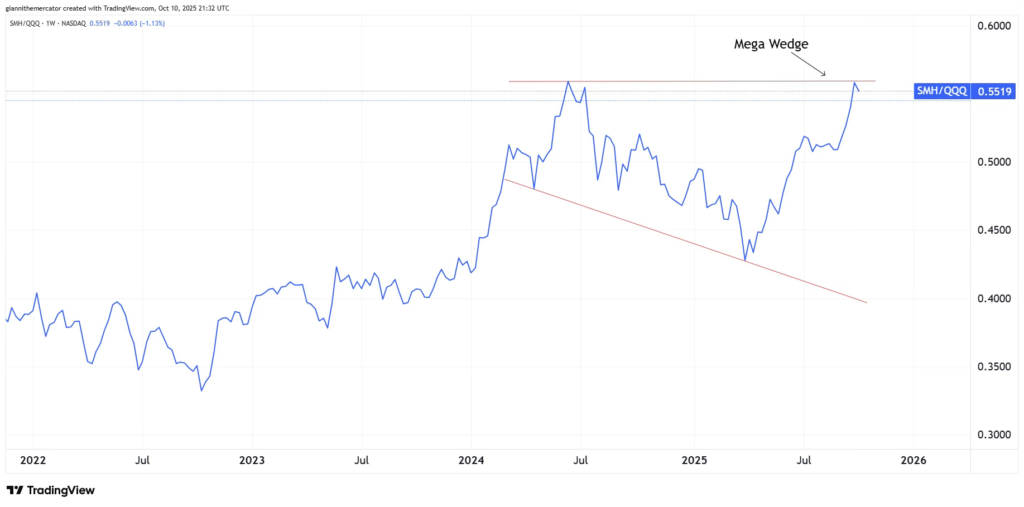
It's time to check back in on perhaps the most important ratio for this entire AI-driven bull market right now. We're looking at the chart between semiconductors (NYSE:SMH) and the Nasdaq 100 (NYSE:QQQ).
The AI revolution is being powered by semiconductors, so it makes total logical sense that we would look for SMH to outperform QQQ as an indicator that the state of the AI trade is in solid health.
I'm now tracking the mega wedge pattern on this ratio chart. This points to yet another round of accelerating upside momentum in this ratio, if and when it breaks above the upper trendline of the pattern. This means there's still money to be made in the chip trade.
International Money Flows (Sector ETF: VGK/EEM)
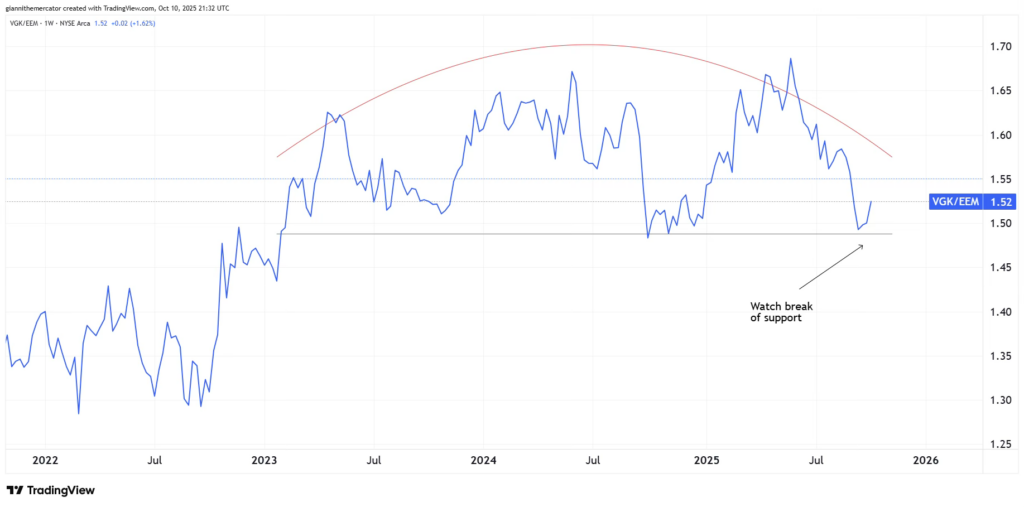
European markets have been all the rage this year, as international stocks finally got a taste of the action that U.S. markets have been experiencing for the past decade and a half. But now, as we are in the early stages of Q4, will Europe still be the world's hot market?
I'm looking at the ratio between European stocks (NYSE:VGK) and emerging markets (NYSE:EEM) below. Since May, emerging markets have actually outperformed European stocks by a fairly wide margin, and we could just be getting started.
I'm keeping a close watch on this developing rounding top formation. We're testing support now, and if it breaks, then the odds of a massive shift away from European stocks into emerging markets is only going to accelerate. This ties into our China bull thesis going forward too, since EEM has a lot of exposure to China.
Watch those Junk Spreads (Sector ETF: HYG/IEI)
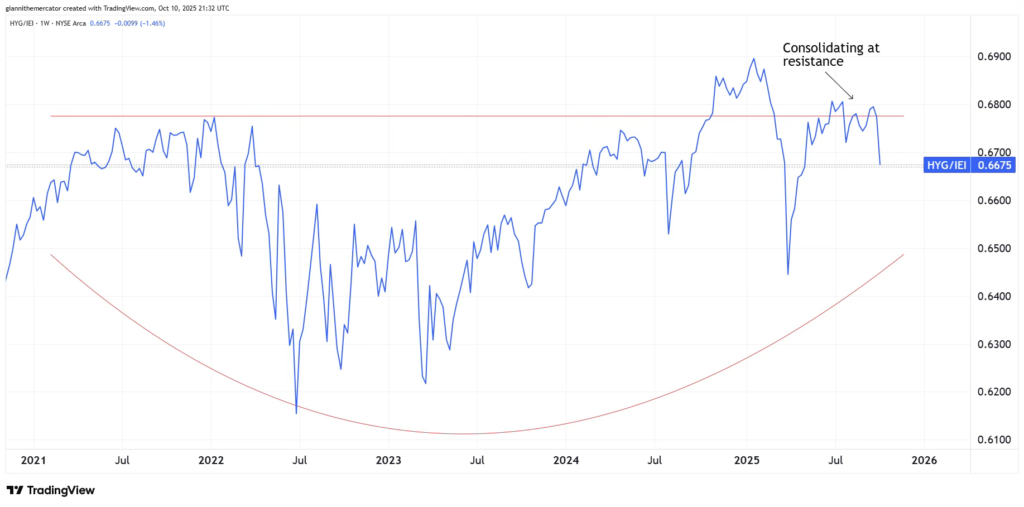
For all the fuss out there about stocks being overvalued, and how the next financial crisis is right around the corner, we're seeing quite a bit of stability in the bond market. I'm looking at the spreads between junk bonds (NYSE:HYG) and 3-7 Year Treasuries (NYSE:IEI) this week.
This ratio provides a key way to measure the market's liquidity conditions. Basically, if junk bonds keep outperforming Treasuries, and this ratio is climbing, then all is well in liquidity land. The opposite is also true – if this ratio is falling – seek some sort of protection.
Currently, it looks like liquidity conditions are about to improve even more. The ratio is hanging out around resistance of a massive saucer formation. If and when it clears, look for market drops to become even more boring.
My Take:
At the end of the day, the bond market is going to tell you a lot more about the health of the overall market compared to some random pundit online. It seems that every other day, there is a warning of an imminent popping of the AI bubble, but ratios like these simply don't support it.
Junk bonds trade like stocks. If liquidity issues arise, they're the first that get hit within the bond complex. In other words, as long as you seem them continuing to rise, keep tuning out the noise and focus on what the market is saying.
Cryptocurrency
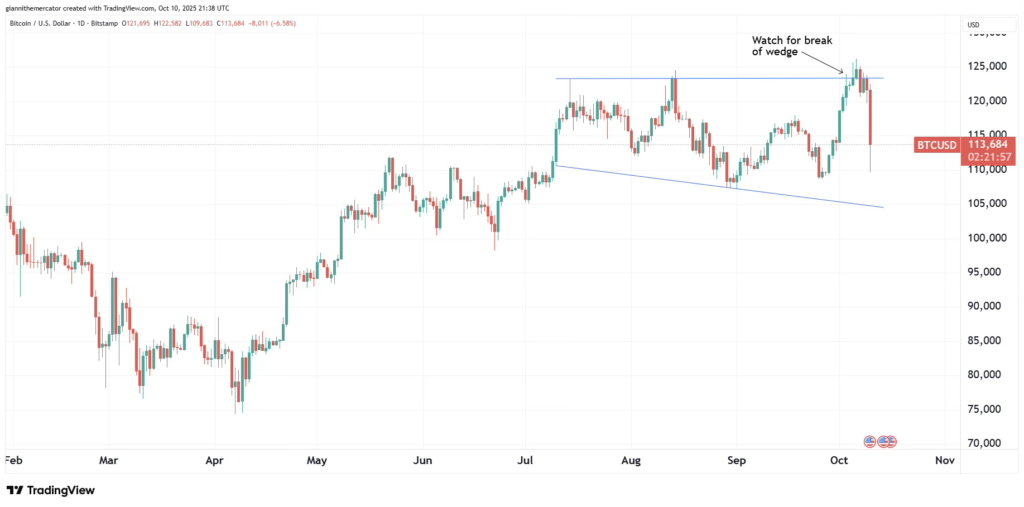
I want to pivot a bit this week and go back to looking at Bitcoin. It's been a while since we looked at the legacy cryptocurrency, but it's fresh off of new all-time highs, which confirms to us that the trend is still very much in favor of the bulls.
I'm keeping a very close watch on a new bullish technical development. Another wedge pattern has formed on the daily chart for Bitcoin, and prices are consolidating just under resistance. A break above there would open the door for another leg higher in the bull market.
The pattern is projecting a rally up to the 138,000-140,000 zone, but we'll need to see a decisive close above 124,000-125,000 first. The path of least resistance in Bitcoin remains higher so long as prices hold above 110,000-112,000.
Legal Disclosures:
This communication is provided for information purposes only.
This communication has been prepared based upon information, including market prices, data and other information, from sources believed to be reliable, but Benzinga does not warrant its completeness or accuracy except with respect to any disclosures relative to Benzinga and/or its affiliates and an analyst’s involvement with any company (or security, other financial product or other asset class) that may be the subject of this communication. Any opinions and estimates constitute our judgment as of the date of this material and are subject to change without notice. Past performance is not indicative of future results. This communication is not intended as an offer or solicitation for the purchase or sale of any financial instrument. Benzinga does not provide individually tailored investment advice. Any opinions and recommendations herein do not take into account individual client circumstances, objectives, or needs and are not intended as recommendations of particular securities, financial instruments or strategies to particular clients. You must make your own independent decisions regarding any securities, financial instruments or strategies mentioned or related to the information herein. Periodic updates may be provided on companies, issuers or industries based on specific developments or announcements, market conditions or any other publicly available information. However, Benzinga may be restricted from updating information contained in this communication for regulatory or other reasons. Clients should contact analysts and execute transactions through a Benzinga subsidiary or affiliate in their home jurisdiction unless governing law permits otherwise.
This communication may not be redistributed or retransmitted, in whole or in part, or in any form or manner, without the express written consent of Benzinga. Any unauthorized use or disclosure is prohibited. Receipt and review of this information constitutes your agreement not to redistribute or retransmit the contents and information contained in this communication without first obtaining express permission from an authorized officer of Benzinga. Copyright 2022 Benzinga. All rights reserved.