Options Corner: Patient Palantir Bulls Just Got Their Green Light
Author: Josh Enomoto | October 14, 2025 03:44pm
No one's going to deny that Palantir Technologies Inc (NASDAQ:PLTR) has represented one of the top publicly traded enterprises in recent memory. Really, the stats speak for themselves. Since the start of the year, PLTR stock gained 139%. Over the past 52 weeks, it's up 317%. However, the extreme performance raises concerns about holding the bag. That's why a recent quantitative signal warrants closer examination.
To understand the argument, we need to have a solid understanding of the multi-dimensional nature of market probabilities. At the core, the market represents a constant negotiation between bulls and bears. As such, it necessarily means that at the end of the session, the underlying transaction is mechanically a zero-sum game.
If a trade exists, it necessarily means that there's another party taking the opposite-side bet. As such, there will always be a winner and a loser.
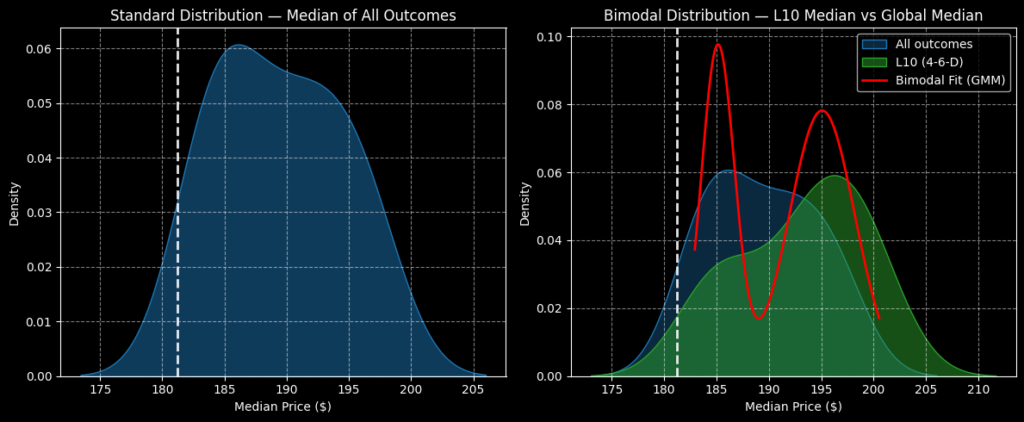
What makes PLTR stock so special is that since its initial public offering, there is statistically a greater chance of your long position being profitable over the next 10 weeks relative to your starting point. When you plot the density of projected outcomes, PLTR stock will mostly land approximately between $175 and $205.
Further, the bulk of outcomes would be expected to land between $185 and $195. Thus, the distributional return profile resembles a bell curve, with a noticeably bullish bias. Without getting into the math, this is an intuitive inference given the dramatic performance of PLTR stock.
However, we also know from GARCH (Generalized Auto-Regressive Conditional Heteroskedasticity) studies that volatility doesn't diffuse independently and linearly but clusters based on prior catalysts. In other words, volatility today depends largely on the magnitude of volatility yesterday. And volatility that happened five years ago is far less relevant to the current sentiment regime than kinetic developments occurring in the more immediate frame.
In other words, the market responds to near-term stimuli more so than stimuli in the deep past, which brings us to the current quant signal.
PLTR Stock Finally Flashed A Sentiment Reversal
As with any other writer focused on the capital markets, I've closely followed Palantir but I've rarely discussed it as a vehicle for options-based speculation, especially with the current model that I use. The reason? PLTR stock has previously refused to flash a quant signal that I can work with — until now, that is.
As stated earlier, volatility tends to cluster. Thus, when a security consistently prints a relatively balanced signal of accumulative and distributive transactions, it's difficult to distinguish its projected behavioral pattern relative to the aggregate baseline. However, when volatility occurs — essentially when distributive pressures outweigh accumulative — the projected behavior of the stock changes.
Basically, under volatility, the stock is no longer in its homeostatic state but is instead under pressure. Where I distinguish myself from every other writer in the financial publication industry is that I developed an algorithm to isolate the performance of the "pressure population" relative to the homeostatic population.
What does this look like in practice? In the trailing 10 weeks, PLTR stock has printed a 4-6-D sequence: four up weeks, six down weeks, with an overall downward trajectory across the period. Is there anything special about this sequence? Absolutely not. But the reason I use sequences instead of raw prices is that I can separate all 4-6-D sequences as their own unique population.
Image by author
When plotting the "sequential" population relative to the global or parent population, we end up charting a bimodal distribution rather than a normal distribution. That is, even though we're looking at numbers from the same dataset — density of expected 10-week outcomes of PLTR stock — the behavioral pattern tied to the 4-6-D offers higher odds of a greater reward.
In other words, whether you buy PLTR stock randomly or only when the security flashes the 4-6-D quant signal, the chances of being profitable relative to the anchor is about the same (though the 4-6-D holds a clear edge in certain weeks). However, the actual return is statistically superior if you were to only buy when the quant signal flashes.
Advantaging The Favorable Inefficiency
Now, for the really fascinating part, options are basically priced using frameworks derived from the Black-Scholes-Merton (BSM) model, which in part assumes a lognormal distribution or a normal distribution consisting of only positive figures. Further, the width of the projected distribution is separated only by the implied volatility of the target options chain.
Image by author
BSM is a prescriptive model whereas the algorithm I use is descriptive; that is, I plot out distributions based on the security's actual data. So, if there is a positive asymmetry between BSM and my algorithm, there's a solid chance of a favorable inefficiency.
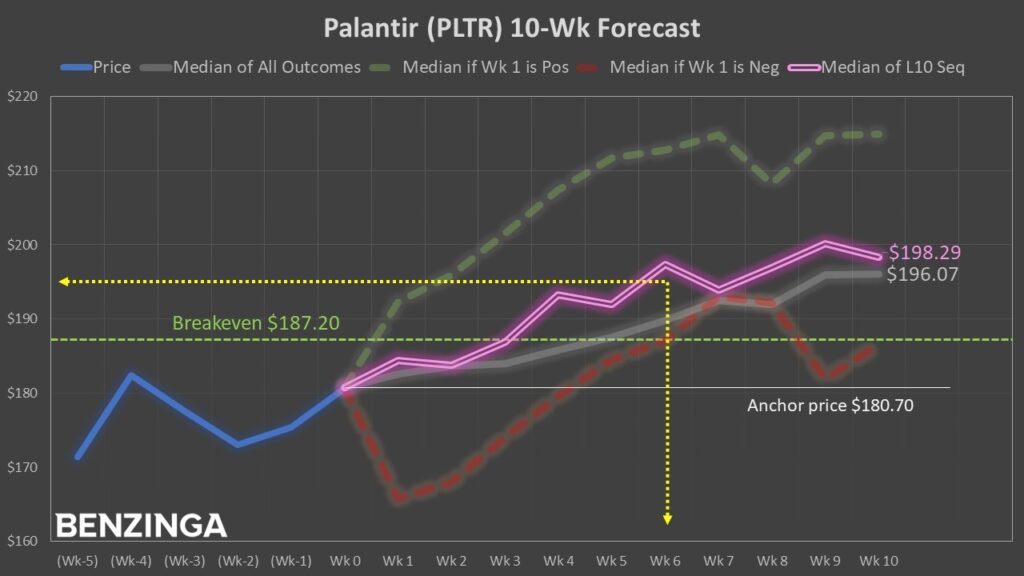
Long story short, I believe the 185/190 bull call spread expiring Nov. 21 is mispriced in your favor. This transaction will require PLTR stock to rise through the second-leg strike price ($190) at expiration. If it does, the payout clocks in at over 127%.
Granted, the breakeven price of $187.20 is elevated and would ordinarily be considered aggressive. However, under 4-6-D conditions, investors tend to buy the dip. Therefore, consideration of the 185/190 spread is a wager not on my opinion but rather the statistical response of PLTR stock under pressure.
The opinions and views expressed in this content are those of the individual author and do not necessarily reflect the views of Benzinga. Benzinga is not responsible for the accuracy or reliability of any information provided herein. This content is for informational purposes only and should not be misconstrued as investment advice or a recommendation to buy or sell any security. Readers are asked not to rely on the opinions or information herein, and encouraged to do their own due diligence before making investing decisions.