Earnings Outlook For SLB
Author: Benzinga Insights | October 16, 2025 10:03am
SLB (NYSE:SLB) will release its quarterly earnings report on Friday, 2025-10-17. Here's a brief overview for investors ahead of the announcement.
Analysts anticipate SLB to report an earnings per share (EPS) of $0.67.
Anticipation surrounds SLB's announcement, with investors hoping to hear about both surpassing estimates and receiving positive guidance for the next quarter.
New investors should understand that while earnings performance is important, market reactions are often driven by guidance.
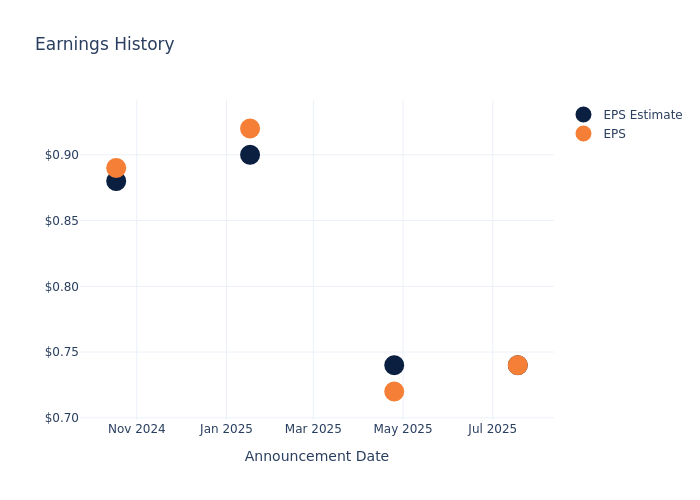
Performance in Previous Earnings
During the last quarter, the company reported an EPS missed by $0.00, leading to a 0.0% drop in the share price on the subsequent day.
Here's a look at SLB's past performance and the resulting price change:
| Quarter |
Q2 2025 |
Q1 2025 |
Q4 2024 |
Q3 2024 |
| EPS Estimate |
0.74 |
0.74 |
0.90 |
0.88 |
| EPS Actual |
0.74 |
0.72 |
0.92 |
0.89 |
| Price Change % |
-4.00 |
-1.00 |
6.00 |
-5.00 |
Tracking SLB's Stock Performance
Shares of SLB were trading at $32.57 as of October 15. Over the last 52-week period, shares are down 22.22%. Given that these returns are generally negative, long-term shareholders are likely bearish going into this earnings release.
Insights Shared by Analysts on SLB
For investors, grasping market sentiments and expectations in the industry is vital. This analysis explores the latest insights regarding SLB.
With 5 analyst ratings, SLB has a consensus rating of Buy. The average one-year price target is $51.2, indicating a potential 57.2% upside.
Understanding Analyst Ratings Among Peers
In this analysis, we delve into the analyst ratings and average 1-year price targets of Baker Hughes, Halliburton and TechnipFMC, three key industry players, offering insights into their relative performance expectations and market positioning.
- Analysts currently favor an Outperform trajectory for Baker Hughes, with an average 1-year price target of $52.1, suggesting a potential 59.96% upside.
- Analysts currently favor an Neutral trajectory for Halliburton, with an average 1-year price target of $25.27, suggesting a potential 22.41% downside.
- Analysts currently favor an Outperform trajectory for TechnipFMC, with an average 1-year price target of $45.0, suggesting a potential 38.16% upside.
Insights: Peer Analysis
In the peer analysis summary, key metrics for Baker Hughes, Halliburton and TechnipFMC are highlighted, providing an understanding of their respective standings within the industry and offering insights into their market positions and comparative performance.
| Company |
Consensus |
Revenue Growth |
Gross Profit |
Return on Equity |
| SLB |
Buy |
-6.49% |
$1.61B |
5.09% |
| Baker Hughes |
Outperform |
-3.21% |
$1.61B |
4.04% |
| Halliburton |
Neutral |
-5.54% |
$819M |
4.52% |
| TechnipFMC |
Outperform |
8.99% |
$593.30M |
8.52% |
Key Takeaway:
SLB ranks at the bottom for Revenue Growth among its peers. It is in the middle for Gross Profit. SLB is at the top for Return on Equity.
Delving into SLB's Background
SLB is the world's premier oilfield-services company as measured by market share. While the industry is largely fragmented, SLB holds the first or second competitive position in many of the differentiated oligopolies in which it operates. Also known as Schlumberger, the company was founded in 1926 by two brothers bearing the same last name. Today, it's most known as a global industry leader in innovation, while it focuses its strategy on its three growth engines: its core, digital, and new energy businesses. Over three-fourths of its revenue base is tied to international markets, while the company boasts roughly $3 billion in digital-related revenue.
SLB: Delving into Financials
Market Capitalization Highlights: Above the industry average, the company's market capitalization signifies a significant scale, indicating strong confidence and market prominence.
Revenue Challenges: SLB's revenue growth over 3 months faced difficulties. As of 30 June, 2025, the company experienced a decline of approximately -6.49%. This indicates a decrease in top-line earnings. When compared to others in the Energy sector, the company faces challenges, achieving a growth rate lower than the average among peers.
Net Margin: SLB's net margin is impressive, surpassing industry averages. With a net margin of 11.87%, the company demonstrates strong profitability and effective cost management.
Return on Equity (ROE): SLB's ROE stands out, surpassing industry averages. With an impressive ROE of 5.09%, the company demonstrates effective use of equity capital and strong financial performance.
Return on Assets (ROA): SLB's ROA stands out, surpassing industry averages. With an impressive ROA of 2.07%, the company demonstrates effective utilization of assets and strong financial performance.
Debt Management: SLB's debt-to-equity ratio stands notably higher than the industry average, reaching 0.67. This indicates a heavier reliance on borrowed funds, raising concerns about financial leverage.
To track all earnings releases for SLB visit their earnings calendar on our site.
This article was generated by Benzinga's automated content engine and reviewed by an editor.
Posted In: SLB


