Understanding Meta Platforms's Position In Interactive Media & Services Industry Compared To Competitors
Author: Benzinga Insights | October 16, 2025 11:00am
In today's rapidly changing and highly competitive business world, it is vital for investors and industry enthusiasts to carefully assess companies. In this article, we will perform a comprehensive industry comparison, evaluating Meta Platforms (NASDAQ:META) against its key competitors in the Interactive Media & Services industry. By analyzing important financial metrics, market position, and growth prospects, we aim to provide valuable insights for investors and shed light on company's performance within the industry.
Meta Platforms Background
Meta is the largest social media company in the world, boasting close to 4 billion monthly active users worldwide. The firm's "Family of Apps," its core business, consists of Facebook, Instagram, Messenger, and WhatsApp. End users can leverage these applications for a variety of different purposes, from keeping in touch with friends to following celebrities and running digital businesses for free. Meta packages customer data, gleaned from its application ecosystem and sells ads to digital advertisers. While the firm has been investing heavily in its Reality Labs business, it remains a very small part of Meta's overall sales.
| Company |
P/E |
P/B |
P/S |
ROE |
EBITDA (in billions) |
Gross Profit (in billions) |
Revenue Growth |
| Meta Platforms Inc |
26.04 |
9.24 |
10.41 |
9.65% |
$25.12 |
$39.02 |
21.61% |
| Alphabet Inc |
26.76 |
8.37 |
8.32 |
7.96% |
$39.19 |
$57.39 |
13.79% |
| Baidu Inc |
11.12 |
1.08 |
2.26 |
2.69% |
$8.84 |
$14.36 |
-3.59% |
| Reddit Inc |
89.62 |
15.74 |
21.51 |
3.88% |
$0.07 |
$0.45 |
77.69% |
| Pinterest Inc |
12.08 |
4.71 |
6 |
0.82% |
$0.0 |
$0.8 |
16.93% |
| Bilibili Inc |
361.65 |
5.60 |
2.77 |
1.53% |
$0.81 |
$2.68 |
19.76% |
| Trump Media & Technology Group Corp |
180.78 |
2 |
965.72 |
-1.26% |
$-0.01 |
$0.0 |
5.54% |
| CarGurus Inc |
28.03 |
7.99 |
4 |
5.34% |
$0.06 |
$0.2 |
7.01% |
| ZoomInfo Technologies Inc |
41.08 |
2.11 |
2.86 |
1.5% |
$0.09 |
$0.26 |
5.21% |
| Weibo Corp |
8.10 |
0.78 |
1.73 |
3.58% |
$0.15 |
$0.34 |
1.58% |
| Yelp Inc |
15.35 |
2.83 |
1.57 |
5.98% |
$0.07 |
$0.33 |
3.75% |
| Tripadvisor Inc |
33.04 |
2.94 |
1.23 |
5.67% |
$0.09 |
$0.49 |
6.44% |
| Ziff Davis Inc |
23.37 |
0.82 |
1.09 |
1.44% |
$0.09 |
$0.3 |
9.79% |
| FuboTV Inc |
20.37 |
3.22 |
0.88 |
-1.98% |
$0.01 |
$0.08 |
-2.81% |
| Yalla Group Ltd |
8.75 |
1.50 |
3.71 |
4.96% |
$0.03 |
$0.06 |
4.15% |
| Average |
61.44 |
4.26 |
73.12 |
3.01% |
$3.54 |
$5.55 |
11.8% |
After thoroughly examining Meta Platforms, the following trends can be inferred:
-
With a Price to Earnings ratio of 26.04, which is 0.42x less than the industry average, the stock shows potential for growth at a reasonable price, making it an interesting consideration for market participants.
-
It could be trading at a premium in relation to its book value, as indicated by its Price to Book ratio of 9.24 which exceeds the industry average by 2.17x.
-
Based on its sales performance, the stock could be deemed undervalued with a Price to Sales ratio of 10.41, which is 0.14x the industry average.
-
The company has a higher Return on Equity (ROE) of 9.65%, which is 6.64% above the industry average. This suggests efficient use of equity to generate profits and demonstrates profitability and growth potential.
-
With higher Earnings Before Interest, Taxes, Depreciation, and Amortization (EBITDA) of $25.12 Billion, which is 7.1x above the industry average, the company demonstrates stronger profitability and robust cash flow generation.
-
Compared to its industry, the company has higher gross profit of $39.02 Billion, which indicates 7.03x above the industry average, indicating stronger profitability and higher earnings from its core operations.
-
The company's revenue growth of 21.61% exceeds the industry average of 11.8%, indicating strong sales performance and market outperformance.
Debt To Equity Ratio
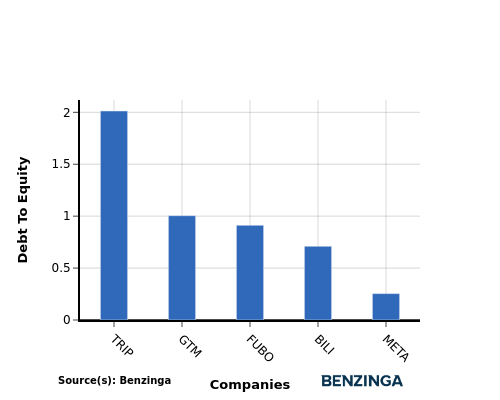
The debt-to-equity (D/E) ratio is a financial metric that helps determine the level of financial risk associated with a company's capital structure.
Considering the debt-to-equity ratio in industry comparisons allows for a concise evaluation of a company's financial health and risk profile, aiding in informed decision-making.
By analyzing Meta Platforms in relation to its top 4 peers based on the Debt-to-Equity ratio, the following insights can be derived:
-
Among its top 4 peers, Meta Platforms has a stronger financial position with a lower debt-to-equity ratio of 0.25.
-
This indicates that the company relies less on debt financing and maintains a more favorable balance between debt and equity, which can be viewed positively by investors.
Key Takeaways
For Meta Platforms, the low PE ratio suggests potential undervaluation compared to peers in the Interactive Media & Services industry. The high PB ratio indicates a premium placed on the company's assets. A low PS ratio implies a favorable sales valuation. The high ROE, EBITDA, gross profit, and revenue growth signify strong profitability and growth potential within the industry sector.
This article was generated by Benzinga's automated content engine and reviewed by an editor.
Posted In: META


