XRP Down 4%: Why $2.30 Is The Last Defense Before A Flush To $1.60
Author: Parshwa Turakhiya | October 22, 2025 12:33pm
XRP (CRYPTO: XRP) is down 4% to $2.39 on Wednesday as traders brace for a potential breakdown below $2.30 — the final support before a deeper retracement that could erase months of gains.
Bearish Triangle Breakdown Threatens Further Losses
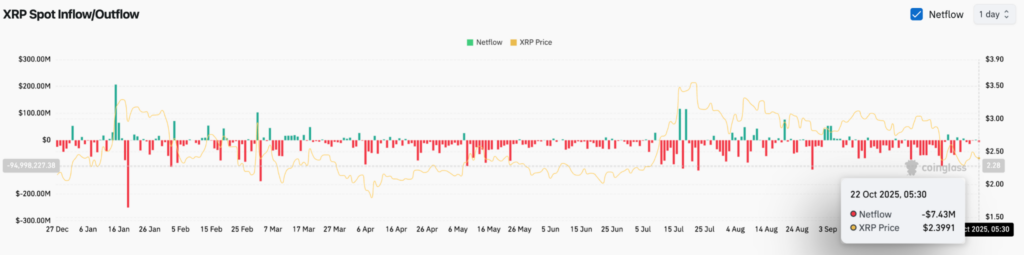
On-chain data from Coinglass shows persistent net outflows through October, indicating that investors are moving tokens back to exchanges rather than accumulating.
The most recent reading on Oct. 22 logged $7.43 million in outflows as XRP traded near $2.39.
The second half of October has been notably quiet, with no large inflow spikes to counter selling.
That absence of whale or institutional accumulation contrasts with the mid-summer period when inflows helped trigger relief rallies.
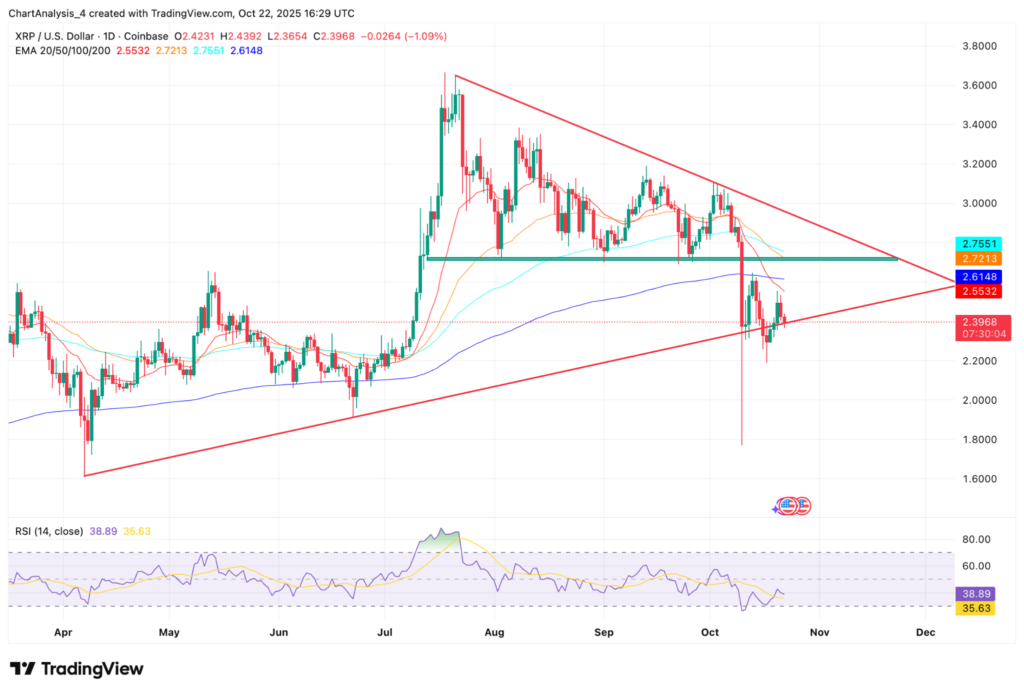
XRP Technical Levels To Watch
Immediate resistance is stacked near $2.55 at the 20-day EMA, followed by $2.61 at the 200-day EMA and $2.75 at the 50-day EMA.
Bulls need a decisive daily close above this cluster to shift near-term tone back toward neutral.
On the downside, $2.30 remains the final defense zone.
A confirmed breakdown below that base opens targets around $1.90 and $1.60, which align with liquidity gaps and the lower boundary of the broader chart structure.