Exploring General Dynamics's Earnings Expectations
Author: Benzinga Insights | October 23, 2025 11:00am
General Dynamics (NYSE:GD) is gearing up to announce its quarterly earnings on Friday, 2025-10-24. Here's a quick overview of what investors should know before the release.
Analysts are estimating that General Dynamics will report an earnings per share (EPS) of $3.72.
Investors in General Dynamics are eagerly awaiting the company's announcement, hoping for news of surpassing estimates and positive guidance for the next quarter.
It's worth noting for new investors that stock prices can be heavily influenced by future projections rather than just past performance.
Performance in Previous Earnings
Last quarter the company beat EPS by $0.24, which was followed by a 0.85% drop in the share price the next day.
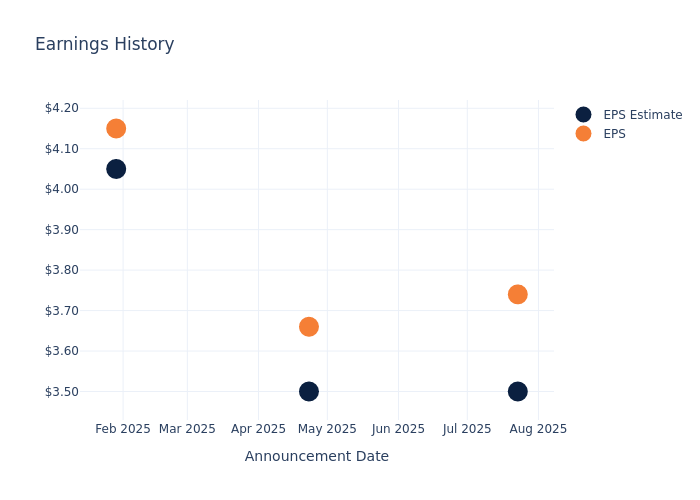
Here's a look at General Dynamics's past performance and the resulting price change:
| Quarter |
Q2 2025 |
Q1 2025 |
Q4 2024 |
Q3 2024 |
| EPS Estimate |
3.50 |
3.50 |
4.05 |
3.47 |
| EPS Actual |
3.74 |
3.66 |
4.15 |
3.35 |
| Price Change % |
-1.00 |
2.00 |
2.00 |
-1.00 |
General Dynamics Share Price Analysis
Shares of General Dynamics were trading at $338.24 as of October 22. Over the last 52-week period, shares are up 12.94%. Given that these returns are generally positive, long-term shareholders are likely bullish going into this earnings release.
Insights Shared by Analysts on General Dynamics
For investors, staying informed about market sentiments and expectations in the industry is paramount. This analysis provides an exploration of the latest insights on General Dynamics.
Analysts have given General Dynamics a total of 3 ratings, with the consensus rating being Buy. The average one-year price target is $362.0, indicating a potential 7.02% upside.
Analyzing Ratings Among Peers
In this analysis, we delve into the analyst ratings and average 1-year price targets of Northrop Grumman, Howmet Aerospace and Lockheed Martin, three key industry players, offering insights into their relative performance expectations and market positioning.
- Analysts currently favor an Buy trajectory for Northrop Grumman, with an average 1-year price target of $683.8, suggesting a potential 102.16% upside.
- Analysts currently favor an Outperform trajectory for Howmet Aerospace, with an average 1-year price target of $206.4, suggesting a potential 38.98% downside.
- Analysts currently favor an Neutral trajectory for Lockheed Martin, with an average 1-year price target of $544.0, suggesting a potential 60.83% upside.
Comprehensive Peer Analysis Summary
The peer analysis summary provides a snapshot of key metrics for Northrop Grumman, Howmet Aerospace and Lockheed Martin, illuminating their respective standings within the industry. These metrics offer valuable insights into their market positions and comparative performance.
| Company |
Consensus |
Revenue Growth |
Gross Profit |
Return on Equity |
| General Dynamics |
Buy |
8.89% |
$1.95B |
4.43% |
| Northrop Grumman |
Buy |
4.27% |
$2.23B |
6.99% |
| Howmet Aerospace |
Outperform |
9.20% |
$619M |
8.37% |
| Lockheed Martin |
Neutral |
8.80% |
$2.24B |
28.12% |
Key Takeaway:
General Dynamics ranks in the middle for Consensus rating among its peers. It is at the bottom for Revenue Growth. The company is at the bottom for Gross Profit. General Dynamics is at the bottom for Return on Equity.
Delving into General Dynamics's Background
General Dynamics is a defense contractor and business jet manufacturer. The firm's segments are aerospace, marine, combat systems, and technologies. General Dynamics' aerospace segment manufactures Gulfstream business jets and operates a global aircraft servicing operation. Combat systems produces land-based combat vehicles such as the M1 Abrams tank and Stryker armored personnel carrier, as well as munitions. The marine segment builds and services nuclear-powered submarines, destroyers, and Navy support ships. The technologies segment contains two main units: an IT business that primarily serves the government market and a mission systems business that focuses on products that provide command, control, computing, intelligence, surveillance, and reconnaissance capabilities to the military.
General Dynamics: Delving into Financials
Market Capitalization Analysis: Above industry benchmarks, the company's market capitalization emphasizes a noteworthy size, indicative of a strong market presence.
Revenue Growth: General Dynamics's remarkable performance in 3 months is evident. As of 30 June, 2025, the company achieved an impressive revenue growth rate of 8.89%. This signifies a substantial increase in the company's top-line earnings. As compared to competitors, the company encountered difficulties, with a growth rate lower than the average among peers in the Industrials sector.
Net Margin: General Dynamics's financial strength is reflected in its exceptional net margin, which exceeds industry averages. With a remarkable net margin of 7.78%, the company showcases strong profitability and effective cost management.
Return on Equity (ROE): General Dynamics's ROE excels beyond industry benchmarks, reaching 4.43%. This signifies robust financial management and efficient use of shareholder equity capital.
Return on Assets (ROA): General Dynamics's ROA excels beyond industry benchmarks, reaching 1.79%. This signifies efficient management of assets and strong financial health.
Debt Management: With a below-average debt-to-equity ratio of 0.45, General Dynamics adopts a prudent financial strategy, indicating a balanced approach to debt management.
To track all earnings releases for General Dynamics visit their earnings calendar on our site.
This article was generated by Benzinga's automated content engine and reviewed by an editor.
Posted In: GD


