Earnings Outlook For Regency Centers
Author: Benzinga Insights | October 27, 2025 11:01am
Regency Centers (NASDAQ:REG) is preparing to release its quarterly earnings on Tuesday, 2025-10-28. Here's a brief overview of what investors should keep in mind before the announcement.
Analysts expect Regency Centers to report an earnings per share (EPS) of $0.79.
Investors in Regency Centers are eagerly awaiting the company's announcement, hoping for news of surpassing estimates and positive guidance for the next quarter.
It's worth noting for new investors that stock prices can be heavily influenced by future projections rather than just past performance.
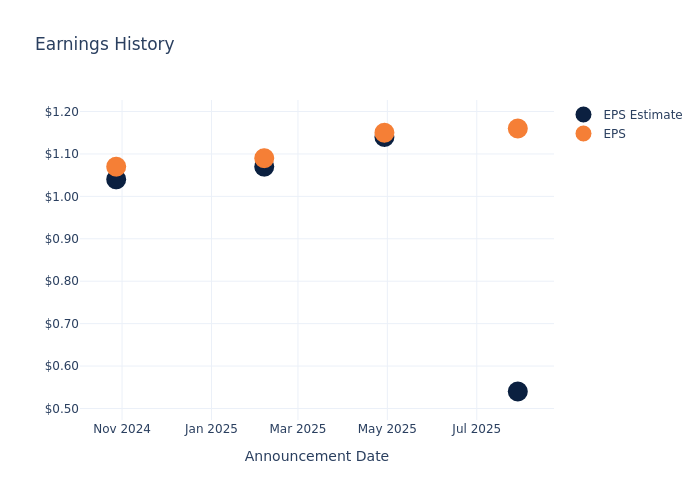
Earnings History Snapshot
Last quarter the company beat EPS by $0.62, which was followed by a 0.77% increase in the share price the next day.
Here's a look at Regency Centers's past performance and the resulting price change:
| Quarter |
Q2 2025 |
Q1 2025 |
Q4 2024 |
Q3 2024 |
| EPS Estimate |
0.54 |
1.14 |
1.07 |
1.04 |
| EPS Actual |
1.16 |
1.15 |
1.09 |
1.07 |
| Price Change % |
1.00 |
0.00 |
1.00 |
1.00 |
Performance of Regency Centers Shares
Shares of Regency Centers were trading at $72.64 as of October 24. Over the last 52-week period, shares are up 0.58%. Given that these returns are generally positive, long-term shareholders are likely bullish going into this earnings release.
Analysts' Perspectives on Regency Centers
For investors, grasping market sentiments and expectations in the industry is vital. This analysis explores the latest insights regarding Regency Centers.
The consensus rating for Regency Centers is Neutral, derived from 11 analyst ratings. An average one-year price target of $79.27 implies a potential 9.13% upside.
Understanding Analyst Ratings Among Peers
The below comparison of the analyst ratings and average 1-year price targets of Kimco Realty, Federal Realty Investment and Brixmor Property Group, three prominent players in the industry, gives insights for their relative performance expectations and market positioning.
- Analysts currently favor an Outperform trajectory for Kimco Realty, with an average 1-year price target of $25.33, suggesting a potential 65.13% downside.
- Analysts currently favor an Outperform trajectory for Federal Realty Investment, with an average 1-year price target of $109.36, suggesting a potential 50.55% upside.
- Analysts currently favor an Outperform trajectory for Brixmor Property Group, with an average 1-year price target of $30.29, suggesting a potential 58.3% downside.
Peers Comparative Analysis Summary
The peer analysis summary presents essential metrics for Kimco Realty, Federal Realty Investment and Brixmor Property Group, unveiling their respective standings within the industry and providing valuable insights into their market positions and comparative performance.
| Company |
Consensus |
Revenue Growth |
Gross Profit |
Return on Equity |
| Regency Centers |
Neutral |
6.61% |
$272.59M |
1.59% |
| Kimco Realty |
Outperform |
4.99% |
$363.31M |
1.47% |
| Federal Realty Investment |
Outperform |
5.23% |
$213.23M |
5.03% |
| Brixmor Property Group |
Outperform |
7.54% |
$256.06M |
2.88% |
Key Takeaway:
Regency Centers ranks in the middle for consensus rating. It ranks at the bottom for revenue growth. It ranks at the top for gross profit. It ranks in the middle for return on equity.
Get to Know Regency Centers Better
Regency Centers is one of the largest shopping center-focused retail REITs. The company's portfolio includes an interest in 483 properties, which includes over 57 million square feet of retail space following the completion of the Urstadt Biddle acquisition in August 2023. The portfolio is geographically diversified with 22 regional offices and no single market representing more than 12% of total company net operating income. Regency's retail portfolio is primarily composed of grocery-anchored centers, with 80% of properties featuring a grocery anchor and grocery stores representing 20% of annual base rent.
Unraveling the Financial Story of Regency Centers
Market Capitalization Highlights: Above the industry average, the company's market capitalization signifies a significant scale, indicating strong confidence and market prominence.
Positive Revenue Trend: Examining Regency Centers's financials over 3 months reveals a positive narrative. The company achieved a noteworthy revenue growth rate of 6.61% as of 30 June, 2025, showcasing a substantial increase in top-line earnings. When compared to others in the Real Estate sector, the company faces challenges, achieving a growth rate lower than the average among peers.
Net Margin: The company's net margin is below industry benchmarks, signaling potential difficulties in achieving strong profitability. With a net margin of 26.94%, the company may need to address challenges in effective cost control.
Return on Equity (ROE): Regency Centers's ROE falls below industry averages, indicating challenges in efficiently using equity capital. With an ROE of 1.59%, the company may face hurdles in generating optimal returns for shareholders.
Return on Assets (ROA): Regency Centers's ROA lags behind industry averages, suggesting challenges in maximizing returns from its assets. With an ROA of 0.81%, the company may face hurdles in achieving optimal financial performance.
Debt Management: With a below-average debt-to-equity ratio of 0.84, Regency Centers adopts a prudent financial strategy, indicating a balanced approach to debt management.
To track all earnings releases for Regency Centers visit their earnings calendar on our site.
This article was generated by Benzinga's automated content engine and reviewed by an editor.
Posted In: REG


