Earnings Preview For Chart Industries
Author: Benzinga Insights | October 28, 2025 02:03pm
Chart Industries (NYSE:GTLS) is set to give its latest quarterly earnings report on Wednesday, 2025-10-29. Here's what investors need to know before the announcement.
Analysts estimate that Chart Industries will report an earnings per share (EPS) of $3.08.
The announcement from Chart Industries is eagerly anticipated, with investors seeking news of surpassing estimates and favorable guidance for the next quarter.
It's worth noting for new investors that guidance can be a key determinant of stock price movements.
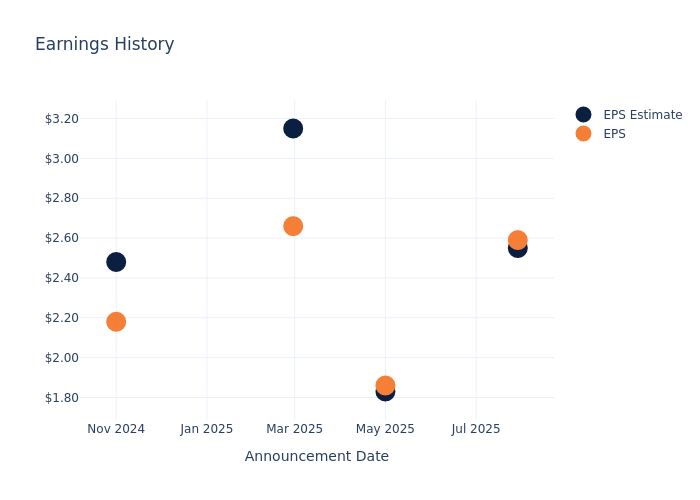
Past Earnings Performance
During the last quarter, the company reported an EPS beat by $0.04, leading to a 0.19% increase in the share price on the subsequent day.
Here's a look at Chart Industries's past performance and the resulting price change:
| Quarter |
Q2 2025 |
Q1 2025 |
Q4 2024 |
Q3 2024 |
| EPS Estimate |
2.55 |
1.83 |
3.15 |
2.48 |
| EPS Actual |
2.59 |
1.86 |
2.66 |
2.18 |
| Price Change % |
0.00 |
3.00 |
5.00 |
8.00 |
Stock Performance
Shares of Chart Industries were trading at $199.5 as of October 27. Over the last 52-week period, shares are up 62.47%. Given that these returns are generally positive, long-term shareholders are likely bullish going into this earnings release.
Analyst Observations about Chart Industries
For investors, grasping market sentiments and expectations in the industry is vital. This analysis explores the latest insights regarding Chart Industries.
Chart Industries has received a total of 2 ratings from analysts, with the consensus rating as Neutral. With an average one-year price target of $210.0, the consensus suggests a potential 5.26% upside.
Peer Ratings Comparison
This comparison focuses on the analyst ratings and average 1-year price targets of Watts Water Technologies, SPX Technologies and Donaldson, three major players in the industry, shedding light on their relative performance expectations and market positioning.
- Analysts currently favor an Buy trajectory for Watts Water Technologies, with an average 1-year price target of $293.5, suggesting a potential 47.12% upside.
- Analysts currently favor an Neutral trajectory for SPX Technologies, with an average 1-year price target of $206.5, suggesting a potential 3.51% upside.
- Analysts currently favor an Neutral trajectory for Donaldson, with an average 1-year price target of $80.33, suggesting a potential 59.73% downside.
Comprehensive Peer Analysis Summary
The peer analysis summary provides a snapshot of key metrics for Watts Water Technologies, SPX Technologies and Donaldson, illuminating their respective standings within the industry. These metrics offer valuable insights into their market positions and comparative performance.
| Company |
Consensus |
Revenue Growth |
Gross Profit |
Return on Equity |
| Chart Industries |
Neutral |
4.04% |
$363.50M |
2.18% |
| Watts Water Technologies |
Buy |
7.77% |
$325.90M |
5.51% |
| SPX Technologies |
Neutral |
10.19% |
$228.90M |
3.51% |
| Donaldson |
Neutral |
4.84% |
$338.80M |
7.83% |
Key Takeaway:
Chart Industries is positioned in the middle among its peers for Consensus rating. It ranks at the bottom for Revenue Growth, indicating lower growth compared to others. In terms of Gross Profit, it is at the top, showcasing strong profitability. However, for Return on Equity, it is at the bottom, suggesting lower returns relative to its peers.
Unveiling the Story Behind Chart Industries
Chart Industries provides a variety of cryogenic equipment for storage, distribution, and other processes within the industrial gas and liquefied natural gas industries. It also provides natural gas processing solutions for the natural gas industry and specialty products that serve a variety of spaces, including hydrogen, biofuels, cannabis, and water treatment. The firm acquired Howden in a significant deal in early 2023, roughly doubling the size of the company. It plans to merge with Flowserve by the end of 2025.
Key Indicators: Chart Industries's Financial Health
Market Capitalization Analysis: Falling below industry benchmarks, the company's market capitalization reflects a reduced size compared to peers. This positioning may be influenced by factors such as growth expectations or operational capacity.
Positive Revenue Trend: Examining Chart Industries's financials over 3 months reveals a positive narrative. The company achieved a noteworthy revenue growth rate of 4.04% as of 30 June, 2025, showcasing a substantial increase in top-line earnings. When compared to others in the Industrials sector, the company faces challenges, achieving a growth rate lower than the average among peers.
Net Margin: The company's net margin is below industry benchmarks, signaling potential difficulties in achieving strong profitability. With a net margin of 6.4%, the company may need to address challenges in effective cost control.
Return on Equity (ROE): The company's ROE is below industry benchmarks, signaling potential difficulties in efficiently using equity capital. With an ROE of 2.18%, the company may need to address challenges in generating satisfactory returns for shareholders.
Return on Assets (ROA): Chart Industries's ROA is below industry averages, indicating potential challenges in efficiently utilizing assets. With an ROA of 0.73%, the company may face hurdles in achieving optimal financial returns.
Debt Management: Chart Industries's debt-to-equity ratio surpasses industry norms, standing at 1.09. This suggests the company carries a substantial amount of debt, posing potential financial challenges.
To track all earnings releases for Chart Industries visit their earnings calendar on our site.
This article was generated by Benzinga's automated content engine and reviewed by an editor.
Posted In: GTLS


