Insights into Amazon.com's Upcoming Earnings
Author: Benzinga Insights | October 29, 2025 12:01pm
Amazon.com (NASDAQ:AMZN) is gearing up to announce its quarterly earnings on Thursday, 2025-10-30. Here's a quick overview of what investors should know before the release.
Analysts are estimating that Amazon.com will report an earnings per share (EPS) of $1.56.
The announcement from Amazon.com is eagerly anticipated, with investors seeking news of surpassing estimates and favorable guidance for the next quarter.
It's worth noting for new investors that guidance can be a key determinant of stock price movements.
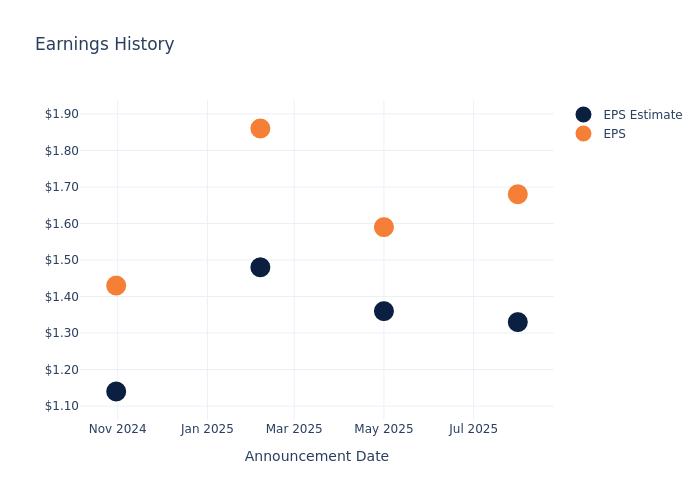
Earnings History Snapshot
The company's EPS beat by $0.35 in the last quarter, leading to a 8.27% drop in the share price on the following day.
Here's a look at Amazon.com's past performance and the resulting price change:
| Quarter |
Q2 2025 |
Q1 2025 |
Q4 2024 |
Q3 2024 |
| EPS Estimate |
1.33 |
1.36 |
1.48 |
1.14 |
| EPS Actual |
1.68 |
1.59 |
1.86 |
1.43 |
| Price Change % |
-8.00 |
0.00 |
-4.00 |
6.00 |
Performance of Amazon.com Shares
Shares of Amazon.com were trading at $229.25 as of October 28. Over the last 52-week period, shares are up 24.01%. Given that these returns are generally positive, long-term shareholders are likely bullish going into this earnings release.
Insights Shared by Analysts on Amazon.com
For investors, grasping market sentiments and expectations in the industry is vital. This analysis explores the latest insights regarding Amazon.com.
With 36 analyst ratings, Amazon.com has a consensus rating of Outperform. The average one-year price target is $269.94, indicating a potential 17.75% upside.
Analyzing Analyst Ratings Among Peers
In this comparison, we explore the analyst ratings and average 1-year price targets of and Amazon.com, three prominent industry players, offering insights into their relative performance expectations and market positioning.
Key Findings: Peer Analysis Summary
In the peer analysis summary, key metrics for and Amazon.com are highlighted, providing an understanding of their respective standings within the industry and offering insights into their market positions and comparative performance.
| Company |
Consensus |
Revenue Growth |
Gross Profit |
Return on Equity |
| Amazon.com |
Outperform |
13.33% |
$86.89B |
5.68% |
Key Takeaway:
Amazon.com is positioned at the top for Revenue Growth among its peers. It ranks in the middle for Gross Profit. Amazon.com is at the bottom for Return on Equity.
Unveiling the Story Behind Amazon.com
Amazon is the leading online retailer and marketplace for third party sellers. Retail related revenue represents approximately 75% of total, followed by Amazon Web Services' cloud computing, storage, database, and other offerings (15%), advertising services (5% to 10%), and other the remainder. International segments constitute 25% to 30% of Amazon's non-AWS sales, led by Germany, the United Kingdom, and Japan.
Financial Insights: Amazon.com
Market Capitalization: Surpassing industry standards, the company's market capitalization asserts its dominance in terms of size, suggesting a robust market position.
Revenue Growth: Amazon.com's revenue growth over a period of 3 months has been noteworthy. As of 30 June, 2025, the company achieved a revenue growth rate of approximately 13.33%. This indicates a substantial increase in the company's top-line earnings. In comparison to its industry peers, the company stands out with a growth rate higher than the average among peers in the Consumer Discretionary sector.
Net Margin: Amazon.com's net margin surpasses industry standards, highlighting the company's exceptional financial performance. With an impressive 10.83% net margin, the company effectively manages costs and achieves strong profitability.
Return on Equity (ROE): Amazon.com's ROE is below industry averages, indicating potential challenges in efficiently utilizing equity capital. With an ROE of 5.68%, the company may face hurdles in achieving optimal financial returns.
Return on Assets (ROA): Amazon.com's ROA stands out, surpassing industry averages. With an impressive ROA of 2.74%, the company demonstrates effective utilization of assets and strong financial performance.
Debt Management: With a below-average debt-to-equity ratio of 0.4, Amazon.com adopts a prudent financial strategy, indicating a balanced approach to debt management.
To track all earnings releases for Amazon.com visit their earnings calendar on our site.
This article was generated by Benzinga's automated content engine and reviewed by an editor.
Posted In: AMZN


