Earnings Preview: Primoris Services
Author: Benzinga Insights | October 31, 2025 11:02am
Primoris Services (NASDAQ:PRIM) will release its quarterly earnings report on Monday, 2025-11-03. Here's a brief overview for investors ahead of the announcement.
Analysts anticipate Primoris Services to report an earnings per share (EPS) of $1.32.
Anticipation surrounds Primoris Services's announcement, with investors hoping to hear about both surpassing estimates and receiving positive guidance for the next quarter.
New investors should understand that while earnings performance is important, market reactions are often driven by guidance.
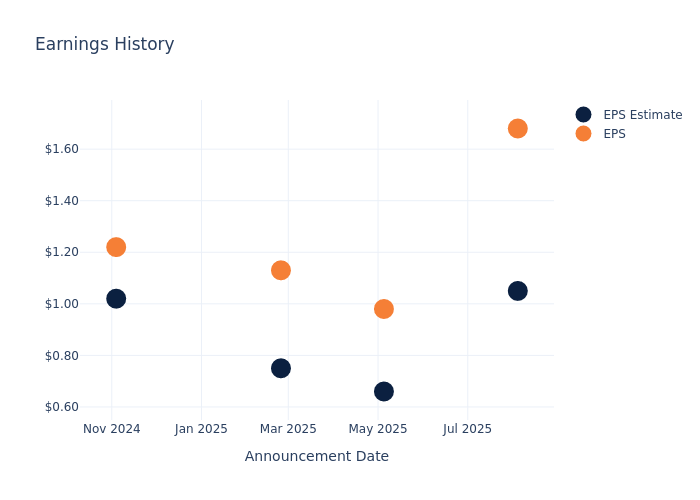
Past Earnings Performance
The company's EPS beat by $0.63 in the last quarter, leading to a 16.65% increase in the share price on the following day.
Here's a look at Primoris Services's past performance and the resulting price change:
| Quarter |
Q2 2025 |
Q1 2025 |
Q4 2024 |
Q3 2024 |
| EPS Estimate |
1.05 |
0.66 |
0.75 |
1.02 |
| EPS Actual |
1.68 |
0.98 |
1.13 |
1.22 |
| Price Change % |
17.00 |
-3.00 |
10.00 |
15.00 |
Market Performance of Primoris Services's Stock
Shares of Primoris Services were trading at $141.74 as of October 30. Over the last 52-week period, shares are up 122.41%. Given that these returns are generally positive, long-term shareholders are likely bullish going into this earnings release.
Analyst Insights on Primoris Services
Understanding market sentiments and expectations within the industry is crucial for investors. This analysis delves into the latest insights on Primoris Services.
The consensus rating for Primoris Services is Buy, based on 13 analyst ratings. With an average one-year price target of $141.77, there's a potential 0.02% upside.
Peer Ratings Overview
This comparison focuses on the analyst ratings and average 1-year price targets of Fluor, Valmont Industries and Dycom Industries, three major players in the industry, shedding light on their relative performance expectations and market positioning.
- Analysts currently favor an Buy trajectory for Fluor, with an average 1-year price target of $52.5, suggesting a potential 62.96% downside.
- Analysts currently favor an Buy trajectory for Valmont Industries, with an average 1-year price target of $455.0, suggesting a potential 221.01% upside.
- Analysts currently favor an Buy trajectory for Dycom Industries, with an average 1-year price target of $304.11, suggesting a potential 114.55% upside.
Overview of Peer Analysis
In the peer analysis summary, key metrics for Fluor, Valmont Industries and Dycom Industries are highlighted, providing an understanding of their respective standings within the industry and offering insights into their market positions and comparative performance.
| Company |
Consensus |
Revenue Growth |
Gross Profit |
Return on Equity |
| Primoris Services |
Buy |
20.91% |
$231.74M |
5.66% |
| Fluor |
Buy |
-5.89% |
$56M |
51.57% |
| Valmont Industries |
Buy |
2.53% |
$318.25M |
6.34% |
| Dycom Industries |
Buy |
14.54% |
$307.49M |
7.40% |
Key Takeaway:
Primoris Services ranks highest in Revenue Growth among its peers. It is at the bottom in Gross Profit. The company is at the bottom in Return on Equity.
Delving into Primoris Services's Background
Primoris Services Corp is a provider of infrastructure services operating mainly in the United States and Canada. It provides a wide range of construction services, maintenance, replacement, fabrication and engineering services to a diversified base of customers. The reportable segments are the Utilities segment and the Energy segment. The Utilities segment operates in a range of services, including the installation and maintenance of new and existing natural gas and electric utility distribution and transmission systems, and communication systems. The Energy segment operates in a range of services that include engineering, procurement, and construction, retrofits, highway and bridge construction, demolition, site work, outages, pipeline construction and maintenance, and others.
A Deep Dive into Primoris Services's Financials
Market Capitalization Analysis: Reflecting a smaller scale, the company's market capitalization is positioned below industry averages. This could be attributed to factors such as growth expectations or operational capacity.
Revenue Growth: Primoris Services's revenue growth over a period of 3 months has been noteworthy. As of 30 June, 2025, the company achieved a revenue growth rate of approximately 20.91%. This indicates a substantial increase in the company's top-line earnings. As compared to its peers, the revenue growth lags behind its industry peers. The company achieved a growth rate lower than the average among peers in Industrials sector.
Net Margin: Primoris Services's net margin lags behind industry averages, suggesting challenges in maintaining strong profitability. With a net margin of 4.46%, the company may face hurdles in effective cost management.
Return on Equity (ROE): Primoris Services's ROE is below industry averages, indicating potential challenges in efficiently utilizing equity capital. With an ROE of 5.66%, the company may face hurdles in achieving optimal financial returns.
Return on Assets (ROA): Primoris Services's ROA falls below industry averages, indicating challenges in efficiently utilizing assets. With an ROA of 1.93%, the company may face hurdles in generating optimal returns from its assets.
Debt Management: Primoris Services's debt-to-equity ratio is below the industry average at 0.7, reflecting a lower dependency on debt financing and a more conservative financial approach.
To track all earnings releases for Primoris Services visit their earnings calendar on our site.
This article was generated by Benzinga's automated content engine and reviewed by an editor.
Posted In: PRIM


