Inquiry Into Microsoft's Competitor Dynamics In Software Industry
Author: Benzinga Insights | November 04, 2025 10:00am
Amidst the fast-paced and highly competitive business environment of today, conducting comprehensive company analysis is essential for investors and industry enthusiasts. In this article, we will delve into an extensive industry comparison, evaluating Microsoft (NASDAQ:MSFT) in comparison to its major competitors within the Software industry. By analyzing critical financial metrics, market position, and growth potential, our objective is to provide valuable insights for investors and offer a deeper understanding of company's performance in the industry.
Microsoft Background
Microsoft develops and licenses consumer and enterprise software. It is known for its Windows operating systems and Office productivity suite. The company is organized into three equally sized broad segments: productivity and business processes (legacy Microsoft Office, cloud-based Office 365, Exchange, SharePoint, Skype, LinkedIn, Dynamics), intelligence cloud (infrastructure- and platform-as-a-service offerings Azure, Windows Server OS, SQL Server), and more personal computing (Windows Client, Xbox, Bing search, display advertising, and Surface laptops, tablets, and desktops).
| Company |
P/E |
P/B |
P/S |
ROE |
EBITDA (in billions) |
Gross Profit (in billions) |
Revenue Growth |
| Microsoft Corp |
36.77 |
10.58 |
13.13 |
7.85% |
$48.06 |
$53.63 |
18.43% |
| Oracle Corp |
59.69 |
30.43 |
12.58 |
13.12% |
$6.12 |
$10.04 |
12.17% |
| ServiceNow Inc |
110.50 |
16.83 |
15.11 |
4.52% |
$0.89 |
$2.63 |
21.81% |
| Palo Alto Networks Inc |
137.02 |
18.97 |
16.86 |
3.37% |
$0.68 |
$1.86 |
15.84% |
| Fortinet Inc |
34.87 |
32.55 |
10.69 |
21.88% |
$0.56 |
$1.32 |
13.64% |
| Nebius Group NV |
156.45 |
8.01 |
109.56 |
16.85% |
$0.61 |
$0.08 |
594.48% |
| Gen Digital Inc |
27.39 |
6.85 |
3.88 |
5.83% |
$0.58 |
$0.99 |
30.26% |
| Monday.Com Ltd |
269.53 |
8.86 |
9.86 |
0.14% |
$-0.01 |
$0.27 |
26.64% |
| UiPath Inc |
529 |
5.06 |
5.80 |
0.09% |
$-0.02 |
$0.3 |
14.38% |
| Dolby Laboratories Inc |
24.49 |
2.44 |
4.80 |
1.78% |
$0.07 |
$0.27 |
9.25% |
| CommVault Systems Inc |
79.76 |
29.41 |
5.80 |
5.12% |
$0.02 |
$0.22 |
18.39% |
| Qualys Inc |
24.93 |
8.89 |
7.25 |
9.4% |
$0.06 |
$0.14 |
10.32% |
| BlackBerry Ltd |
120 |
3.91 |
5.33 |
1.83% |
$0.02 |
$0.1 |
2.69% |
| Average |
131.14 |
14.35 |
17.29 |
6.99% |
$0.8 |
$1.52 |
64.16% |
After examining Microsoft, the following trends can be inferred:
-
At 36.77, the stock's Price to Earnings ratio is 0.28x less than the industry average, suggesting favorable growth potential.
-
The current Price to Book ratio of 10.58, which is 0.74x the industry average, is substantially lower than the industry average, indicating potential undervaluation.
-
Based on its sales performance, the stock could be deemed undervalued with a Price to Sales ratio of 13.13, which is 0.76x the industry average.
-
The company has a higher Return on Equity (ROE) of 7.85%, which is 0.86% above the industry average. This suggests efficient use of equity to generate profits and demonstrates profitability and growth potential.
-
The Earnings Before Interest, Taxes, Depreciation, and Amortization (EBITDA) of $48.06 Billion is 60.08x above the industry average, highlighting stronger profitability and robust cash flow generation.
-
The company has higher gross profit of $53.63 Billion, which indicates 35.28x above the industry average, indicating stronger profitability and higher earnings from its core operations.
-
The company is witnessing a substantial decline in revenue growth, with a rate of 18.43% compared to the industry average of 64.16%, which indicates a challenging sales environment.
Debt To Equity Ratio
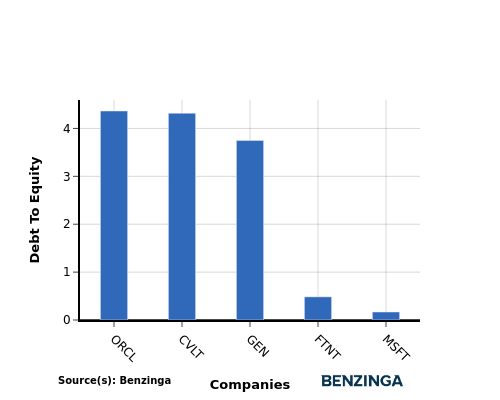
The debt-to-equity (D/E) ratio provides insights into the proportion of debt a company has in relation to its equity and asset value.
Considering the debt-to-equity ratio in industry comparisons allows for a concise evaluation of a company's financial health and risk profile, aiding in informed decision-making.
By analyzing Microsoft in relation to its top 4 peers based on the Debt-to-Equity ratio, the following insights can be derived:
-
Microsoft demonstrates a stronger financial position compared to its top 4 peers in the sector.
-
With a lower debt-to-equity ratio of 0.17, the company relies less on debt financing and maintains a healthier balance between debt and equity, which can be viewed positively by investors.
Key Takeaways
For Microsoft in the Software industry, the PE, PB, and PS ratios are all low compared to peers, indicating potential undervaluation. On the other hand, Microsoft's high ROE, EBITDA, and gross profit suggest strong profitability and operational efficiency relative to industry competitors. However, the low revenue growth rate may raise concerns about future performance compared to industry peers.
This article was generated by Benzinga's automated content engine and reviewed by an editor.
Posted In: MSFT


