Poster Child of AI Data Center Trade Stumbles, SoftBank Sells Nvidia
Author: The Arora Report | November 11, 2025 11:45am
The Wide Spread AI Investing Myth
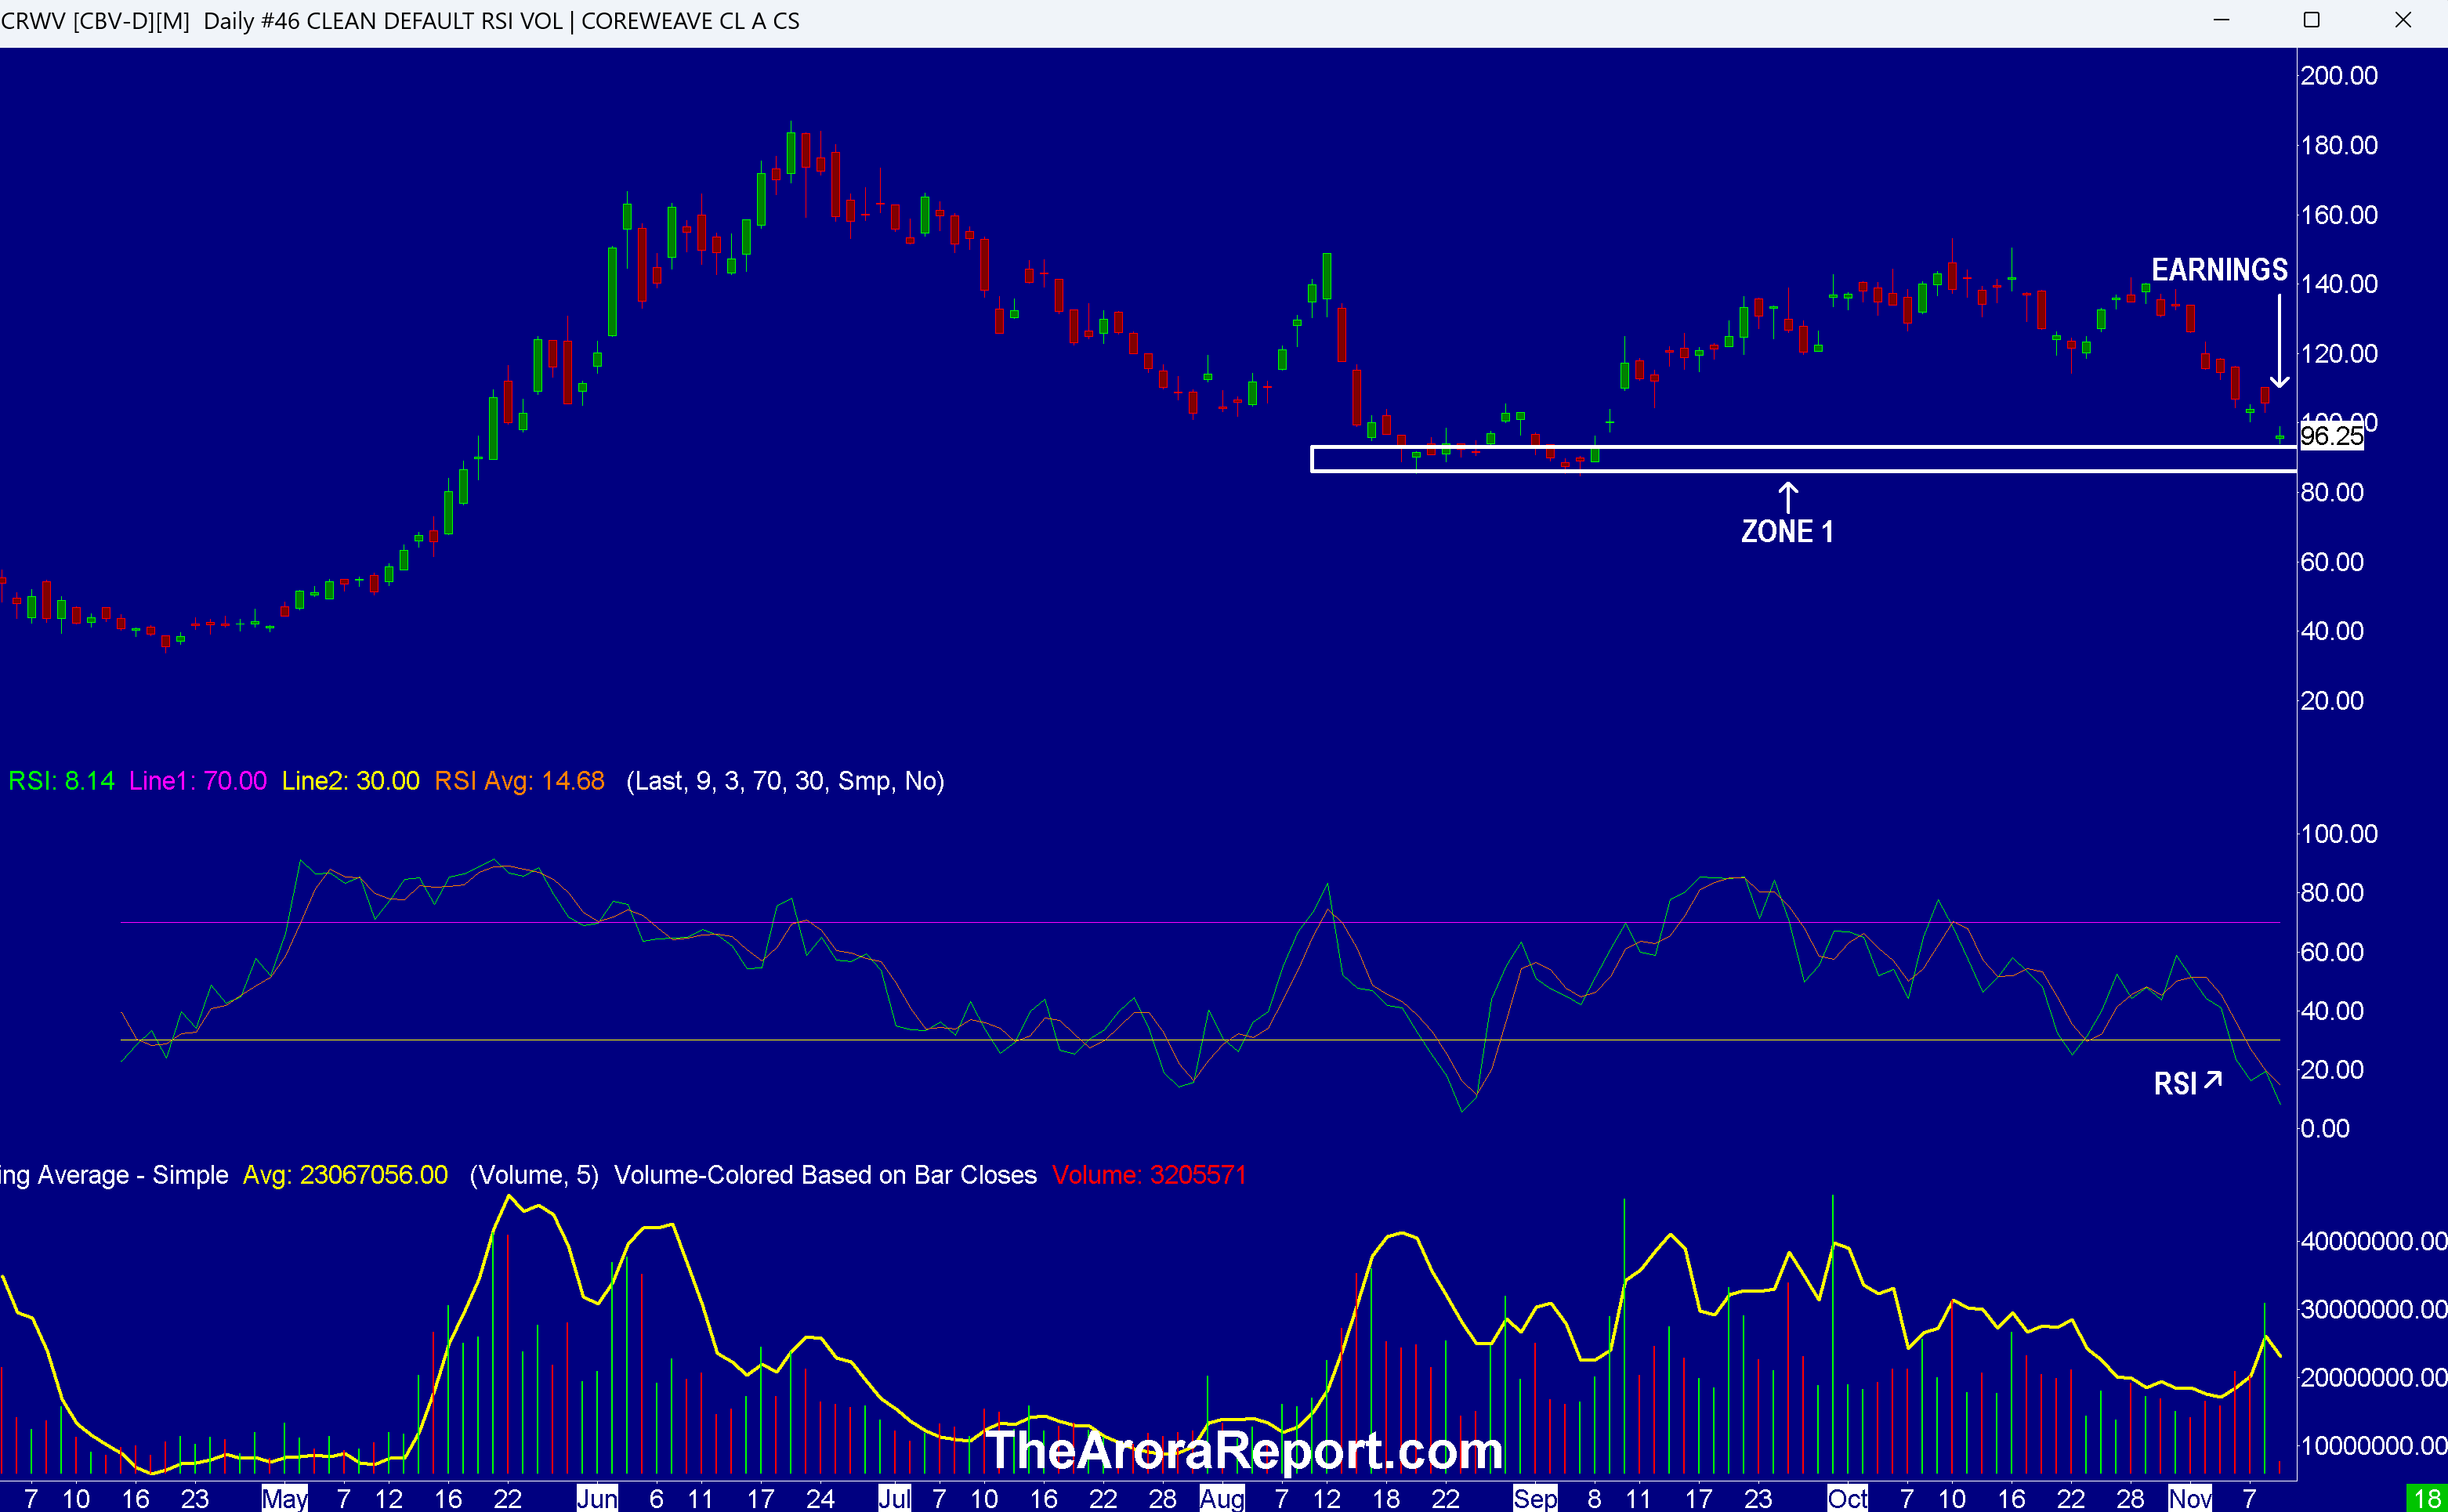
Please click here for a chart of CoreWeave Inc (NASDAQ:CRWV).
Note the following:
This article is about the big picture, not an individual stock. The chart of CRWV stock is being used to illustrate the point. CoreWeave is the poster child of the AI data center trade among the momo crowd. CoreWeave is one of the most important AI stocks for investors.
The chart shows the gap down on earnings.
The chart shows CRWV stock has fallen below the psychologically important level of $100 as of this writing in the premarket.
The chart shows CRWV stock fell to the top of zone 1 (support). For the AI trade, it is critical that this zone holds.
CoreWeave is a recent IPO. CRWV IPO was priced at $40. The chart shows initially CRWV stock fell as low as $33.51, below the IPO price. There were several reasons for the stock to fall:
Investors felt CRWV stock was over hyped.
Investors were concerned about very high debt levels.
Investors were convinced of the high demand for AI data centers but were concerned about supply chain issues and power issues that might get in the way of rapid data center development.
CoreWeave buys NVIDIA Corp (NASDAQ:NVDA) GPUs, sets up the data centers, and rents out the capacity. The concern has been the longevity of the demand relative to supply when current contracts expire.
Nvidia has a very rapid cycle of introducing new products. The concern has been that the servers in the data centers can rapidly become obsolete.
There have been serious concerns that CorWeave may be depreciating AI chips slower than they should.
Data centers are historically a low margin business once demand stabilizes.
After the initial drop, CRWV stock caught the attention of the momo crowd.
The chart shows the momo crowd ran CRWV stock all the way to $187. Along the way, short sellers who saw the valuation as absurd initially lost money in a short squeeze. However, short sellers who stuck with the trade made out like bandits.
Here are the key points from CoreWeave earnings:
Adjusted EPS came at $0.22 vs. $0.40 consensus.
Revenue came at $1.36B vs. $1.29B.
Revenue projections came at $5.05B – $5.15B vs. $5.287B consensus.
Data center development by a third party developer is behind schedule. The reason is difficulties in the supply chain, especially with transformers.
AI demand far exceeds capacity.
There is a widespread belief, especially among the momo crowd, that all one has to do to make money in AI is to buy AI stocks that are pumped in the media. This is irrespective of the price and without deep analysis. The momo crowd's plan is to hold these stocks because they think AI stocks are going to the moon. The chart shows that this widespread belief about investing in AI is a myth.
In our analysis, all prior massive capex cycles after the invention of something new have ultimately led to a bust, which subsequently led to large losses for investors. This happened after the invention of electricity, railroads, automobiles, and the internet. The probability is low that the massive AI capex will end differently, especially for AI trades popular among the momo crowd.
Japan's SoftBank Group Corp – ADR (OTC:SFTBY) has sold all of its shares of NVDA and also some shares of T-Mobile Us Inc (NASDAQ:TMUS). As full disclosure, both NVDA and TMUS are in our portfolio. We are long NVDA from $12.55 and TMUS from $12.54.
In our analysis, SoftBank selling NVDA and TMUS stock is not as concerning as it sounds on the surface. The reason is SoftBank is investing $30B in ChatGPT maker OpenAI. SoftBank needs money for this investment.
In the pre-government reopening euphoria among investors, four things are throwing a monkey wrench this morning:
SoftBank selling NVDA shares
CoreWeave earnings
Quantum computing company Rigetti (RGTI) earnings. Rigetti reported Q3 revenue of $1.9M vs. $2.17M consensus and much higher whisper numbers. Rigetti's market cap is $10.7B.
ADP data shows there was an average of 11,250 job losses per week for the four weeks ending October 25, 2025. Expectations in the market had been for a gain.
Of note, Advanced Micro Devices Inc (NASDAQ:AMD) will be outlining its AI business plan to financial analysts today.
India
On the positive side, President Trump is saying he is close to a trade deal with India. On the negative side, explosions rocked both India and Pakistan.
Magnificent Seven Money Flows
Most portfolios are now heavily concentrated in the Mag 7 stocks. For this reason, it is important to pay attention to early money flows in the Mag 7 stocks on a daily basis.
In the early trade, money flows are neutral in Apple Inc (NASDAQ:AAPL).
In the early trade, money flows are negative in Amazon.com, Inc. (NASDAQ:AMZN), Alphabet Inc Class C (NASDAQ:GOOG), Meta Platforms Inc (NASDAQ:META), Microsoft Corp (NASDAQ:MSFT), NVIDIA Corp (NVDA), and Tesla Inc (NASDAQ:TSLA).
In the early trade, money flows are negative in SPDR S&P 500 ETF Trust (NYSE:SPY) and Invesco QQQ Trust Series 1 (NASDAQ:QQQ).
Momo Crowd And Smart Money In Stocks
Investors can gain an edge by knowing money flows in SPY and QQQ. Investors can get a bigger edge by knowing when smart money is buying stocks, gold, and oil. The most popular ETF for gold is SPDR Gold Trust (GLD). The most popular ETF for silver is iShares Silver Trust (SLV). The most popular ETF for oil is United States Oil ETF (USO).
Consider continuing to hold good, very long term, existing positions. Based on individual risk preference, consider a protection band consisting of cash or Treasury bills or short-term tactical trades as well as short to medium term hedges and short term hedges. This is a good way to protect yourself and participate in the upside at the same time.
You can determine your protection bands by adding cash to hedges. The high band of the protection is appropriate for those who are older or conservative. The low band of the protection is appropriate for those who are younger or aggressive. If you do not hedge, the total cash level should be more than stated above but significantly less than cash plus hedges.
A protection band of 0% would be very bullish and would indicate full investment with 0% in cash. A protection band of 100% would be very bearish and would indicate a need for aggressive protection with cash and hedges or aggressive short selling.
It is worth reminding that you cannot take advantage of new upcoming opportunities if you are not holding enough cash. When adjusting hedge levels, consider adjusting partial stop quantities for stock positions (non ETF); consider using wider stops on remaining quantities and also allowing more room for high beta stocks. High beta stocks are the ones that move more than the market.
Traditional 60/40 Portfolio
Probability based risk reward adjusted for inflation does not favor long duration strategic bond allocation at this time.
Those who want to stick to traditional 60% allocation to stocks and 40% to bonds may consider focusing on only high quality bonds and bonds of five year duration or less. Those willing to bring sophistication to their investing may consider using bond ETFs as tactical positions and not strategic positions at this time.
**
The Arora Report is known for its accurate calls. The Arora Report correctly called the big artificial intelligence rally before anyone else, the new bull market of 2023, the bear market of 2022, new stock market highs right after the virus low in 2020, the virus drop in 2020, the DJIA rally to 30,000 when it was trading at 16,000, the start of a mega bull market in 2009, and the financial crash of 2008. Please click here to sign up for a free forever Generate Wealth Newsletter.
**
Benzinga Disclaimer: This article is from an unpaid external contributor. It does not represent Benzinga’s reporting and has not been edited for content or accuracy.